
For the First Time, LP-Led and GP-Led Are the Same Size Market
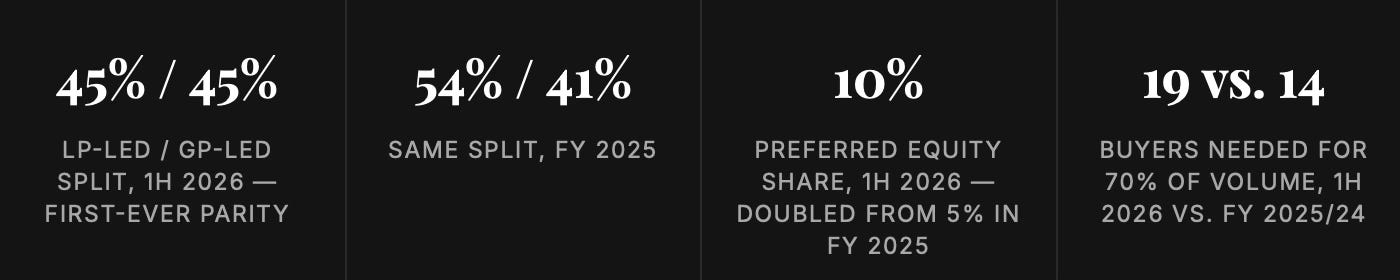
Campbell Lutyens' 1H 2026 Flash Report shows LP-led and GP-led activity converging to roughly 45% of volume each, down from a 54/41 split as recently as FY 2025.


Every year since 2022, LP-led has been the larger half of the secondary market and GP-led the smaller one, sometimes by a little, sometimes by a lot, but never close. In FY 2025, the gap was as wide as it had ever been: 54% LP-led versus 41% GP-led. Six months later, per Campbell Lutyens’ (CL) 1H 2026 Flash Report, the two are within a rounding error of each other: roughly 45% apiece.
That’s not a small move. It’s the sharpest single-period reversal in a market that had otherwise been remarkably stable in its mix.
Four years of the same story, then a break
Look at the annual mix going back to 2022 and the pattern is obvious: LP-led always wins, GP-led is stuck, and preferred equity is a rounding error that keeps shrinking.
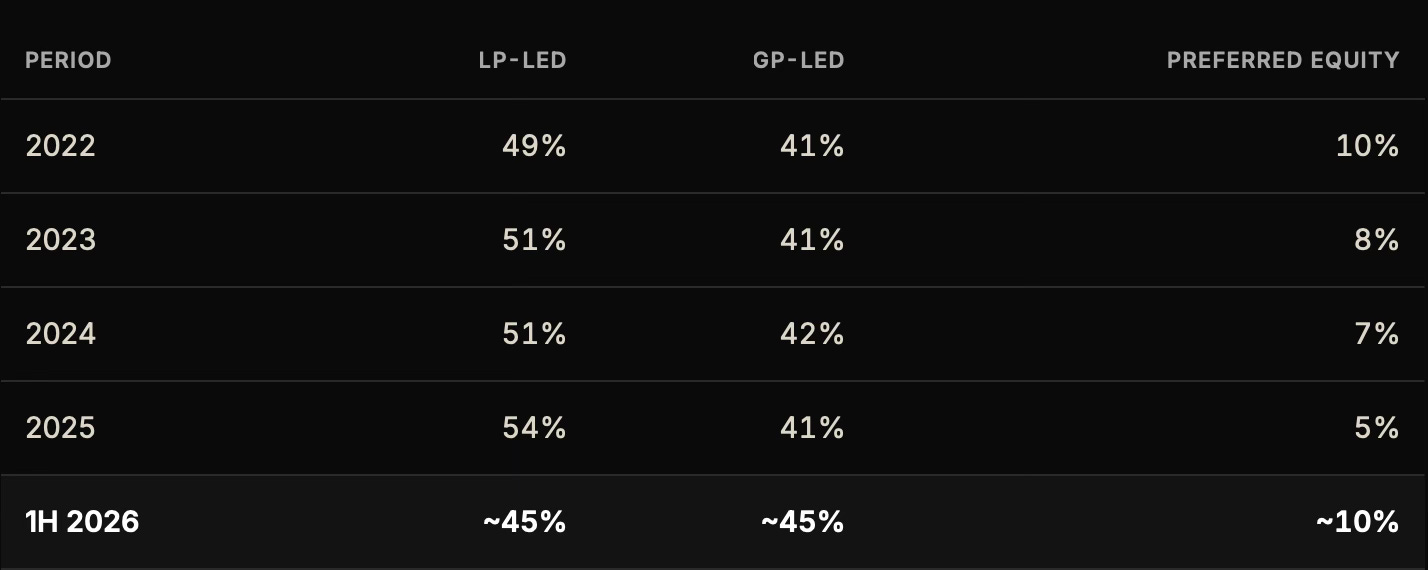
For four straight years, GP-led was pinned at 41–42% of volume — a share so stable it looked structural. It took one half-year to move that number four points, to parity with LP-led, which itself gave up nine points from its FY 2025 peak. Preferred equity did something just as striking in the opposite direction: after shrinking from 10% to just 5% of volume between 2022 and FY 2025, it snapped back to 10% in 1H 2026 — doubling in two quarters.
Secondaries didn’t get bigger. They got more evenly used.
Why parity, and why now
CL frames the GP-led side of this as continuation vehicles becoming a genuine liquidity and strategic fundraising tool across private markets, not a PE-only mechanism (infrastructure GP-led volume alone went from 6% to 15% of the GP-led mix in a year). On the LP-led side, the report notes the secondary fundraising boom is “coming full circle,” with maturing secondary funds themselves increasingly becoming the assets sold in LP-led trades — a self-reinforcing loop that didn’t really exist at this scale before.
The preferred equity rebound points to the same underlying shift: GPs reaching for structured solutions: net asset value loans, preferred equity, hybrid structures, as a working part of the liquidity toolkit rather than a niche product used only when a straight sale or CV won’t work.
The supporting evidence: buyers are following the sellers
Parity isn’t happening in isolation. Two other data points in the same report point the same direction, toward a market broadening out rather than just growing bigger.
The buyer base is deconcentrating. It took only 14 buyers to account for 70% of total volume in both FY 2025 and FY 2024. In 1H 2026, the same 70% share required 19 buyers, a meaningful loosening of a market that had been getting more concentrated, not less.
GPs are bringing their best assets to market on their own terms. Single-asset continuation vehicles (SACVs) recaptured share from multi-asset structures, running at 62% of GP-led volume in 1H 2026 versus 48% in FY 2025, a sign that sponsors increasingly see CVs as a precision tool for a specific trophy asset, not a bundle-and-sell mechanism.
Put together: more buyers, more GPs using CVs deliberately rather than opportunistically, and a structured-solutions layer that’s growing again after years of shrinking. Parity between LP-led and GP-led looks less like a coincidence of one unusual half-year and more like the natural result of a market where both sides of the table are now equally fluent in using secondaries.
Some Thoughts
The number that will get quoted from this report is $120bn, or the $250bn full-year forecast. The number that actually changes the narrative is 45/45. Volume records happen most years now, that’s been true since 2022’s 24% CAGR started compounding. Parity has happened zero times before this one.
Worth watching into 2H 2026 and FY 2026 close: whether the 45/45 split holds as a new normal or whether FY 2025’s LP-led-heavy mix reasserts itself once full-year numbers are in, and whether preferred equity’s rebound to 10% is durable or a one-half spike.
Data and figures in this article are drawn from Campbell Lutyens’ 1H 2026 Secondary Market Flash Report, based on survey responses from 120+ active market participants. CL notes the report is a preliminary marketing communication and has not conducted an official or recognized poll; its full report follows in the coming weeks. Analysis and framing above are Secondary Scoop’s own.