


For most of the past three years, Asia Pacific was the footnote in global secondaries data. APAC accounted for 15% of global GP-led volume in 2022. By 2024 that share had fallen to 4%, with regional GP-led volume down to $2.8bn after two consecutive years of decline.
The 2026 Campbell Lutyens Asia Pacific Private Markets Report, built on CL’s proprietary deal data and a Q2–Q3 survey of 181 LPs, describes a sharp reversal. GP-led volume rebounded 112% to $5.9bn in 2025. This year, closed volume has already passed that full-year figure, and CL estimates a further $10.9bn of deals is currently in market. If those close before December 31, APAC GP-led volume reaches $16.8bn, more than two and a half times the 2022 peak.
The more interesting finding is what isn’t growing with it. On the LP-led side, APAC funds made up just 2% of global transaction volume in H1 2026, unchanged from 2025, and CL reports that several global LPs explored sales of APAC-centric portfolios this year before abandoning them over bid-ask spreads.
The numbers, year by year
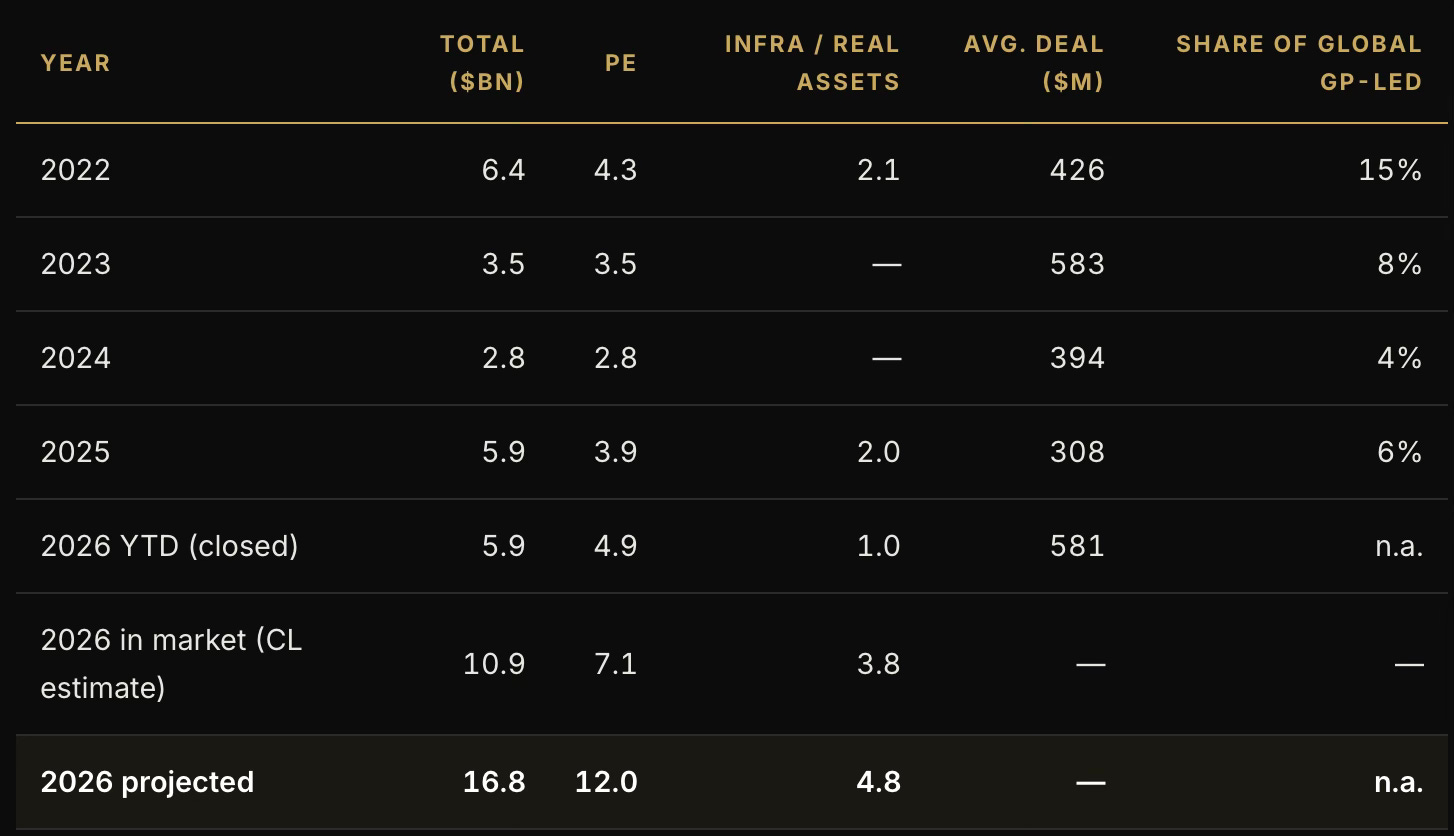
Source: Campbell Lutyens proprietary data. 2026 in-market infra/real assets figure combines $3.3bn infrastructure and $0.5bn real assets. Figures as charted by CL; totals subject to rounding.
NOTES ON THE 2026 FIGURE
The $16.8bn is not closed volume. Roughly $5.9bn has closed; the remaining $10.9bn is deals CL classifies as in market, and the firm describes that number as an approximation based on its own intelligence. The 188% growth figure assumes every one of those deals closes by year-end.
The in-market pipeline also includes four deals with an estimated size of $1bn or more. A small number of slippages into 2027 would move the headline materially. On CL’s own charted numbers, $16.8bn over $5.9bn works out to about 185%; the 188% reflects unrounded underlying data.
Infrastructure rebuilt the market. Private equity is scaling it.
The 2025 recovery was not evenly distributed. GP-led volume rose by $3.1bn, and infrastructure, which registered no GP-led volume in CL’s data for 2023 or 2024, contributed $2.0bn of that increase. Private equity still made up 67% of the year’s total, but the swing factor was infra.
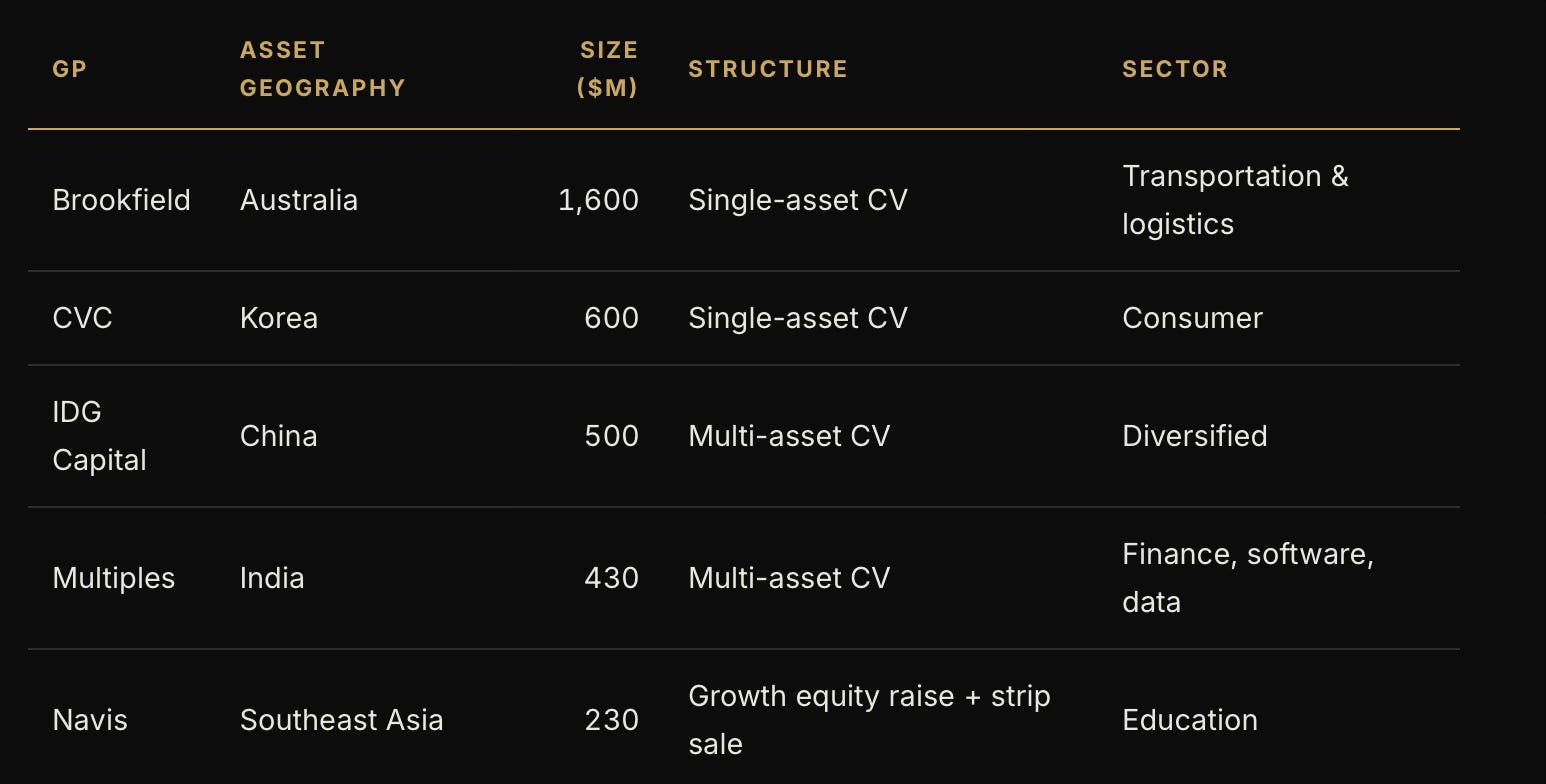
Geographically, 2025 volume was concentrated in two markets: Australia and New Zealand accounted for 41% and Greater China for 27%, followed by India (13%) and Korea (11%). Single-asset continuation vehicles made up 58% of volume, multi-asset CVs 42%. CL highlighted five transactions:
The 2026 numbers point to PE taking over the growth. PE accounts for $4.9bn of closed volume and $7.1bn of the in-market pipeline. The jump in average deal size to $581m, close to 2023’s $583m and nearly double 2025’s $308m, is consistent with CL’s explanation: more megadeals and greater buyer willingness to underwrite them.
“Liquidity is being engineered, by GPs and LPs alike, rather than awaited.”
Campbell Lutyens, foreword to the 2026 Asia Pacific Private Markets Report
From exit route to fundraising engine
The report’s most useful contribution is its two advised case studies, because they show the GP-led as a tool for the next fund rather than the last one.
In the first, an ANZ infrastructure GP ran a A$2.1bn single-asset CV on a digital infrastructure asset in 2022, retaining a co-control stake. CL says stapled capital from the process amounted to roughly 40% of the GP’s new primary fund, which is targeting A$1.4bn against a predecessor of A$400m.
In the second, a Southeast Asian PE manager completed a $230m strip sale in education in 2025, consolidating multiple assets into one platform while returning partial liquidity to LPs. Its next fund targets $1.0bn, up from $890m. The figures match the Navis transaction in CL’s 2025 deal list.
Both new-fund figures are targets, not closes. But the pattern fits what the region’s GPs face: a backlog of maturing assets, LPs asking for DPI ahead of re-ups, and a fundraising market that, by CL’s own data, is rewarding a very small number of franchises.
What buyers are now demanding
The rebound has not loosened terms. CL’s survey describes buyers concentrating on high-quality sponsors and market-leading assets, and treating alignment mechanics as non-negotiable: a full rollover of carry plus either a GP commitment topped up to 5–10% of the vehicle or a co-investment from the flagship fund.
Buyer priorities also split by market. In developed Asia, buyers favor deals where the GP holds control over value creation and governance. In emerging Asia, the priority is a visible, achievable path to exit. That distinction maps onto where volume is clearing: ANZ, Korea and select China and India deals, with Southeast Asia at 4% of 2025 volume.
The LP-led side is still stuck
LP-led activity tells a different story. APAC-domiciled sellers accounted for 18% of global LP-led volume in 2025, a figure CL attributes partly to liquidity- and regulation-driven sales. That fell to 12% in H1 2026. Between 2021 and 2025, the bulk of the region’s LP-led selling came from Taiwanese LPs restructuring private markets books under regulatory pressure, activity CL says has since moderated.
The seller base is broadening, with LPs in China, Malaysia and Hong Kong trimming non-core and tail-end positions, but the larger developed markets remain thin. Japanese deal flow is sporadic and often routed through gatekeepers. Korean sellers face potential capital gains tax leakage. Australian volume remains below pre-COVID levels, though CL sees superannuation consolidation as a possible catalyst.
The more telling figure is on the asset side: APAC funds made up 2% of global LP-led volume in both 2025 and H1 2026. The aborted sales of APAC-centric portfolios this year suggest the constraint is price, not willingness. Buyers are paying for curated assets with a GP’s conviction behind them; they are not yet paying sellers’ prices for diversified APAC fund exposure.
Discounts as an entry ticket
Where the LP-led market does price APAC risk, it prices it steeply. CL, citing Reuters, puts discounts on secondary stakes in top-tier Chinese funds at 40–50%, and says select global secondary buyers are re-entering on the bet that markdowns are excessive for assets with near-term exit visibility. Hong Kong’s IPO rebound in 2025 gives that thesis a plausible exit channel.
The same logic appears elsewhere in the report. In India, 58% of LPs already investing in Indian secondaries said they want to increase exposure, according to CL data. In Southeast Asia, secondaries and co-investments are framed as a way into the region without a full fund-cycle commitment. In both cases, secondaries are functioning as a lower-commitment entry point to markets LPs are hesitant to back through primaries.
WHY THE PRESSURE ISN’T EASING
CL’s exit data explains why GP-led supply should keep coming. APAC PE and infrastructure exits recovered to $195bn in 2025, but reached only $86bn in H1 2026, and CL expects this year to be the first annual decline in traditional exit volume since 2023. CL, citing Bain, adds that the number of PE portfolio companies held for more than five years rose 18% in 2025.