


Jefferies presented its 2026 investor meeting today, and the deck carries a number we have not previously seen Jefferies publish: a continuation vehicle market share of more than 20% across 2025 and 2026 year to date. If accurate, roughly one in every five CVs in the market had Jefferies on the mandate.
The figure carries a footnote, and the footnote is two words long: “Internal estimate.” Every other ranking on the same run of slides is sourced to Dealogic. The CV number is the exception.
Where the number sits
Jefferies did not file CV advisory under a secondaries heading. It placed the 20%+ figure inside its “Large-Cap Private Equity M&A” pillar, one of four pillars the bank says its investment banking franchise is now built on. The other stat on that slide is a #3 ranking in PE M&A over $1 billion. Jefferies is presenting CV advisory to shareholders as part of its core sponsor business, sitting alongside sell-side M&A as another exit route it can run for the same clients.
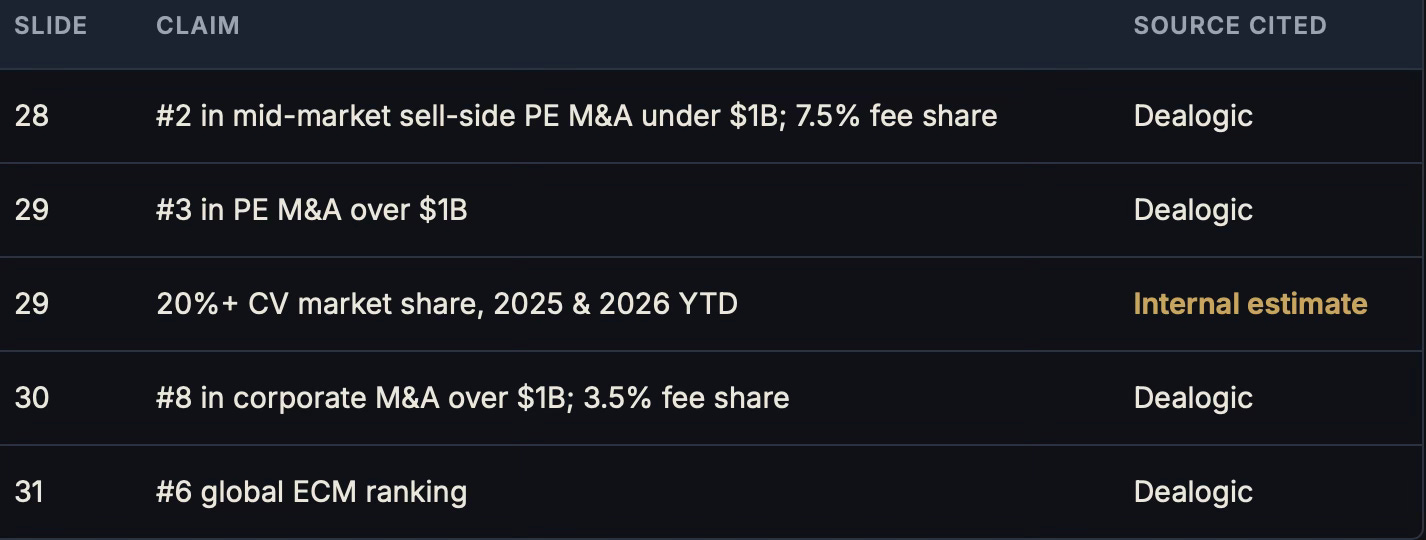
Source: Jefferies 2026 Investor Meeting presentation, slides 28–31 and endnotes (slides 61–62).
A note on terms: the M&A rankings on slides 28 and 29 cover sponsor exits sold to other buyers, including secondary buyouts. They are not secondaries-market data and should not be read as part of the CV claim.
Does the math hold?
Jefferies’ own market reviews give us a denominator. Its February 2026 review put 2025 GP-led volume at $115 billion. Its July 2026 review put H1 2026 GP-led volume at $62 billion and sized CVs at 89% of GP-led volume in both periods. Applying the 20% floor to those figures gives the implied volume Jefferies would need to have advised.

Secondary Scoop calculation from Jefferies Global Secondary Market Review data (February and July 2026). Assumes the share is measured by volume, which the deck does not state.
The one hard number Jefferies has published on its own activity is consistent with that. The July review states that its Secondary Advisory team advised on $30 billion of secondary volume in H1 2026, about a quarter of the $118 billion market. That figure combines LP-led and GP-led work, so it cannot isolate CVs. But it leaves ample room for $11 billion or more of CV mandates in the half.
The denominator also holds up outside Jefferies. Lazard’s 2025 report put GP-led volume at $116 billion, within a billion of Jefferies’ count. Lazard’s interim 2026 report is slightly less generous on structure, putting CVs at 84% of first-half GP-led deployment versus Jefferies’ 89%. A smaller CV pool would make a given amount of Jefferies activity look like a larger share, so that difference does not undercut the claim.
“CVs have become a mainstream exit mechanism.”
Jefferies, Global Secondary Market Review, July 2026
WHAT THE 20%+ FIGURE LEAVES UNDEFINED
Count or volume. A share of deals and a share of dollars can diverge sharply in a market where Jefferies counted more than 25 CVs above $1 billion executed in H1 2026 alone.
Which side. The deck does not say whether this counts only sell-side mandates for the GP or also buy-side and fairness work.
Closed or signed. Jefferies’ review volumes are closed transactions; the deck’s “YTD” figure is not described.
Whose denominator. Jefferies’ market reviews are built from transactions executed by its own Secondary Advisory team plus public, non-Jefferies deals. Jefferies’ deals sit in both the numerator and the denominator.
Why it matters to a bank’s shareholders
The more interesting question is why Jefferies chose to put the number in front of equity investors at all. The July review gives part of the answer: 82 of the top 100 sponsors by AUM have now executed a CV, and GP-led transactions accounted for 14% of sponsor-backed exit volume. For a bank whose investment banking business was, by its own description on slide 27, historically weighted toward sponsors, a CV is now a standard product to sell the same client base.
It also helps explain the shape of Jefferies’ sponsor franchise. A bank that ranks #2 in mid-market sell-side PE M&A and advises on a fifth of CVs is positioned on both exit routes a sponsor weighs for a mature asset: sell it, or roll it. Jefferies does not break out secondaries advisory revenue, so the deck offers no way to size what that is worth inside its $2.7 billion of LTM advisory revenue.
A crowded field with no scoreboard
Jefferies is not the only advisor claiming the lead. Evercore’s H1 2026 review describes its private capital advisory group as “the world’s leading secondaries advisory business,” without publishing a share or advised-volume figure of its own. Evercore also counts a slightly larger market than Jefferies: $121 billion of H1 2026 volume and $65 billion GP-led, against Jefferies’ $118 billion and $62 billion, so the same deal book converts into a different share depending on whose total is used. Behind those two sit Lazard, which agreed in April to acquire Campbell Lutyens and expects to close in 2026; PJT Park Hill; Houlihan Lokey; and dedicated GP-led teams at Morgan Stanley, UBS, Rothschild & Co and Moelis, with Raymond James, Baird and William Blair active in the mid-market. None of them publishes a CV share on a comparable basis.
That gap is built into how the market is measured. Market sizing in secondaries comes from the advisors who run the deals: Jefferies, Lazard and Evercore publish the reports the rest of the market cites, and each builds them partly from its own deal flow. That is how a fragmented private market gets measured at all. It also means a share claim like this one cannot be independently checked from public data, and readers should treat it as a well-informed self-assessment rather than a league table.
The claim does not need to be exact to be meaningful. Even at a share in the mid-teens, Jefferies would be among the two or three dominant CV advisors at a time when the advisory field is consolidating. A rival publishing a competing figure, measured on the same basis, would be the most useful next data point.