

Secondary markets in venture are now large enough to warrant the same level of attention as IPOs and M&A, yet they are still often treated as a side topic rather than a core part of market structure. The recent data suggest that framing is outdated. With transaction volume crossing $100 billion in the US and continuing to grow globally, secondaries are no longer just filling gaps; they are reshaping how liquidity is generated and distributed across the venture ecosystem.
This article looks at what is actually driving that shift, how different transaction types are contributing to scale, where the market is still constrained, and what the current data implies about how secondaries will evolve relative to traditional exit paths.
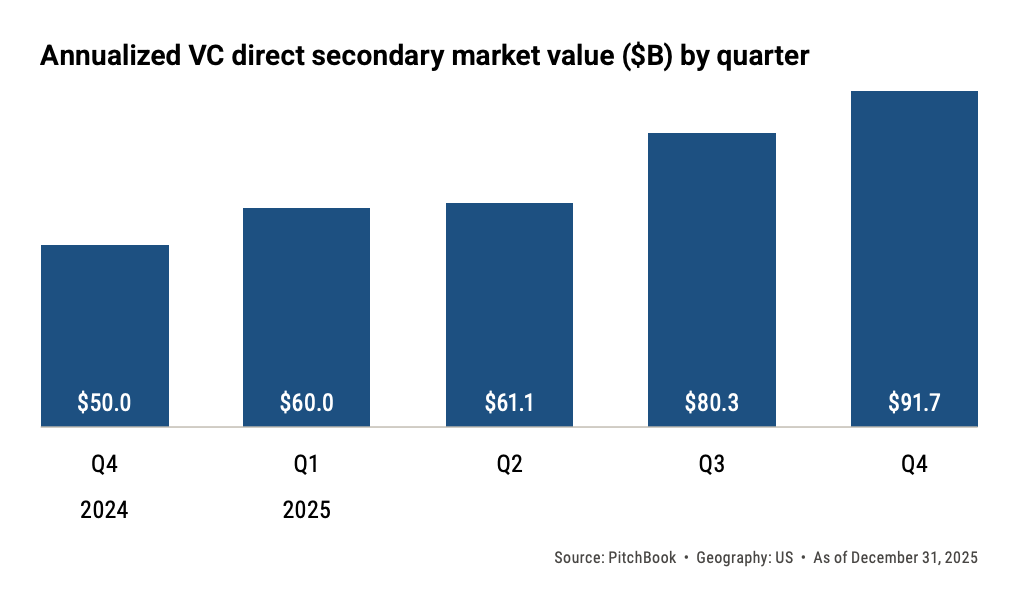
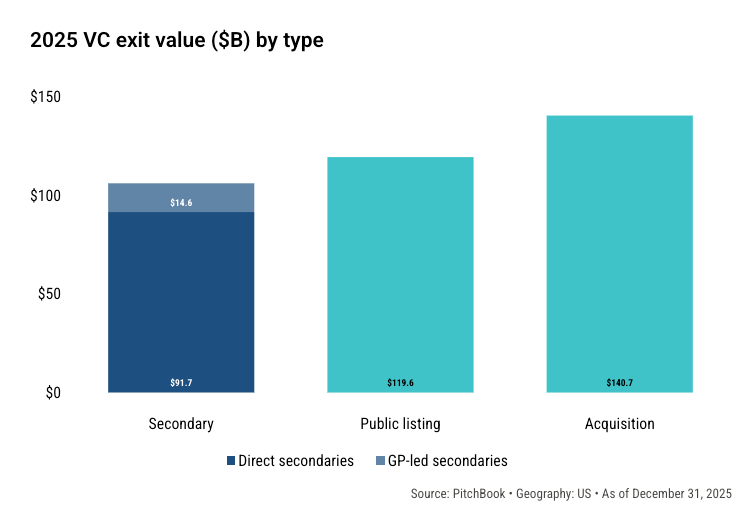
US venture secondaries reached $91.7 billion in 2025, and combined with GP-led venture secondaries, we have a total of $106.3 billion. That number should be understood in context. As recently as 2024, total annual secondary volume was closer to ~$50 billion. The market has effectively doubled in a short period, and the acceleration has been consistent across multiple quarters rather than driven by a single event.
Direct secondaries account for the majority of this activity. PitchBook estimates a range of $62.5 billion to $120.9 billion for direct transactions alone. The width of that range reflects incomplete visibility into private transactions, not volatility in demand. Across datasets, directionality is consistent: volume is increasing, and dispersion is narrowing over time as more transactions move through intermediated platforms.
At this level, secondaries are now operating at a scale comparable to traditional exit channels. This is particularly visible when compared to IPO markets, where annual VC-backed issuance remains below historical averages and has not cleared accumulated inventory.
Growth is distributed across transaction types
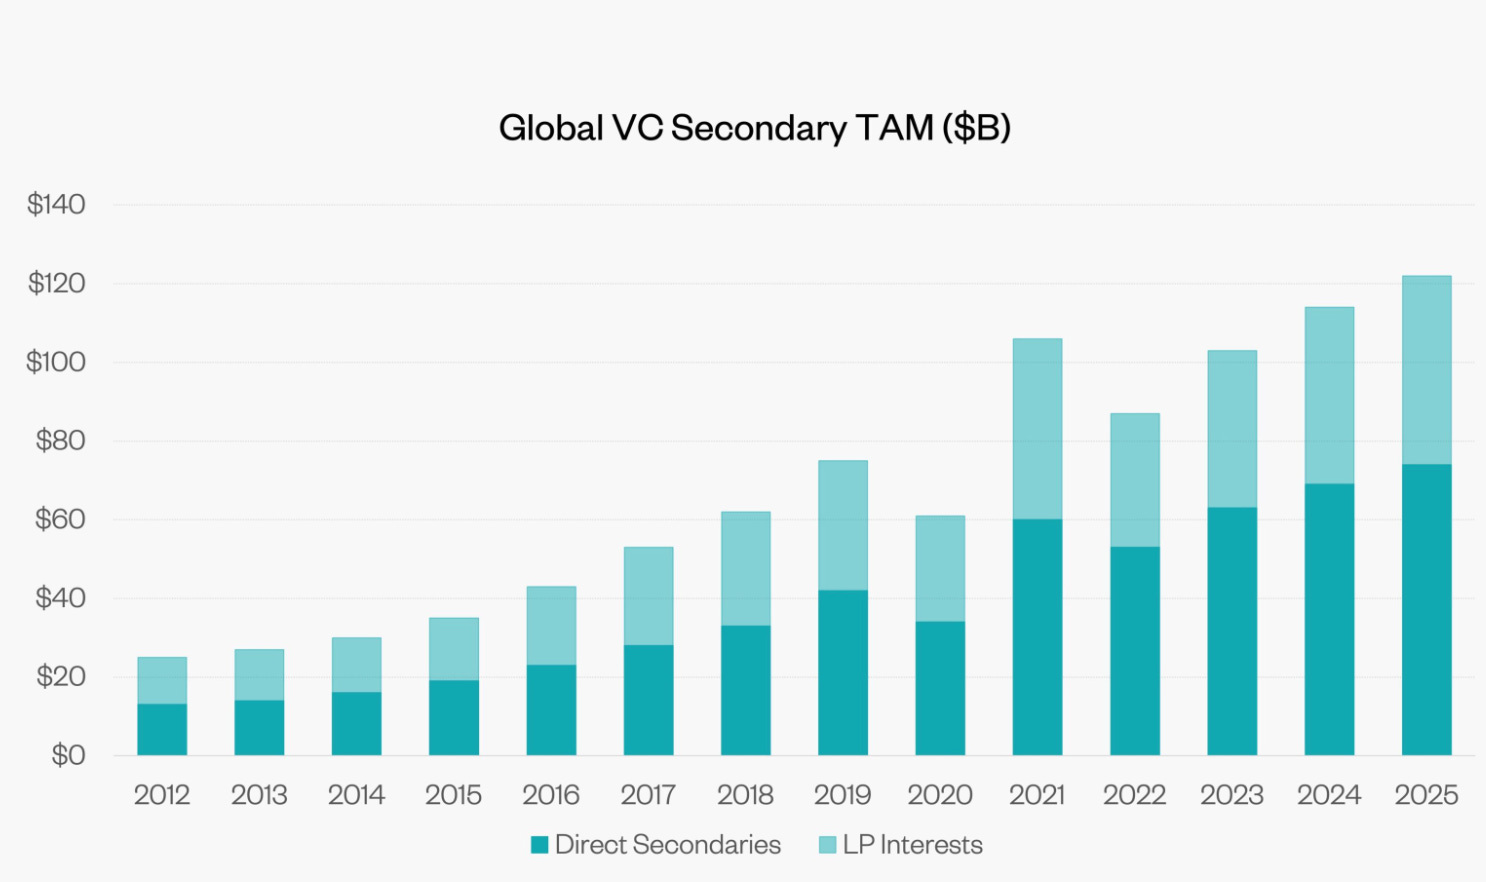
The expansion of the market is not concentrated in one structure. It is occurring across direct transactions, LP stake sales, and GP-led processes, each addressing a different source of liquidity demand.
Direct secondaries remain the largest component, driven primarily by employee and early investor sales in late-stage companies. These transactions tend to cluster around companies with recent primary rounds, where price discovery is clearer, and bid-ask spreads are narrower.
At the same time, LP-led secondaries are increasing as institutional investors rebalance portfolios. In 2025, LP-led venture secondaries represented a growing share of activity, reaching roughly 22% of LP-led secondary volume, up from low double-digit levels in prior years.
GP-led secondaries are also scaling, particularly through continuation vehicles. These structures allow sponsors to extend holding periods while providing liquidity to existing LPs. In broader private markets, GP-led transactions now represent a meaningful share of exit activity, accounting for ~16% of sponsor exits in 2025.
At the global level, the same pattern is more pronounced. Secondary transaction volume across private markets exceeded $200 billion in 2025, with expectations of continued growth toward $300 billion over the next few years.
The implication is that secondaries are not scaling through a single dominant format. They are scaling as a set of complementary mechanisms, each tied to a different source of supply.
The convergence with IPOs and M&A
The growth of secondaries is directly linked to constraints in traditional exit markets.
IPO activity has recovered modestly but remains below historical norms in both volume and consistency. In 2025, only a few dozen VC-backed companies went public, raising less capital than required to normalize liquidity across the venture ecosystem.
M&A activity has improved but is still insufficient relative to the backlog of venture-backed companies. At the same time, distributions to LPs remain below long-term averages, which increases pressure on funds to generate liquidity through alternative channels.
This combination, limited exits, extended holding periods, and low distributions, creates persistent demand for secondary transactions.
Secondaries address that demand in a way that is not tied to full company exits. They allow partial liquidity at the asset level (direct secondaries) or at the fund level (LP sales and continuation vehicles).
Importantly, this function is consistent across cycles. In periods of strong markets, secondaries provide access to oversubscribed assets. In constrained markets, they provide liquidity when exits are unavailable. The underlying mechanism does not change, only the use case.
Market size is large, but depth remains concentrated
Secondary activity is concentrated in a relatively small number of companies. Large, late-stage names with recent funding rounds dominate transaction volume because they offer both liquidity and pricing visibility. Smaller or less frequently financed companies remain difficult to trade.
This concentration is visible in multiple datasets. Even at the current scale, the secondary market represents only a small share of the total private market value. For example, in mid-2025, direct secondaries represented approximately 1.9% of total unicorn value.
The gap between market size and market depth is important. It means that secondaries have achieved scale in aggregate volume, but liquidity is not evenly distributed.
There are early signs of expansion. The number of companies with secondary activity is increasing, and pricing dispersion has narrowed as more transactions establish reference points. Median transaction sizes have also increased significantly, with some estimates showing growth from under $10 million to over $60 million in a short period.
However, the market remains dependent on a relatively narrow set of high-quality assets for the majority of its volume.
Demand is expanding, but capital formation lags
On the demand side, participation is increasing across multiple investor types.
Dedicated secondary funds are raising larger vehicles, institutional investors are allocating more capital to secondaries, and new entrants—including crossover funds and private wealth vehicles—are entering the market.
At the same time, transaction volume has grown faster than capital formation. Even as global secondary markets exceed $200 billion in annual volume, the available capital base remains relatively concentrated.
This imbalance has several implications. High-quality assets clear efficiently and often at tight discounts or premiums, particularly when recent primary pricing exists. Lower-quality or less visible assets face limited buyer interest and wider discounts.
The result is a bifurcated market where capital is sufficient for top-tier opportunities but constrained elsewhere.
Future thoughts
Secondaries have reached a scale where they function as a parallel liquidity market to traditional exits. The main factors are:
Extended holding periods in venture-backed companies
Persistent mismatch between liquidity demand and exit capacity
Increasing institutionalization of capital and transaction structures
At the same time, the market remains uneven. Liquidity is concentrated, capital is not uniformly distributed, and pricing remains fragmented outside the most active assets.
The current state can be summarized as follows: secondaries have achieved scale in transaction volume, but not yet breadth in participation or consistency in liquidity.
That gap is the defining feature of the market today and the main variable that will determine how it develops from here.