
The $260 Billion Hole That Won't Close
Everyone is covering secondaries volume records. Almost no one is covering why those records are structurally guaranteed to keep breaking, regardless of what happens to exits, IPOs, or interest rates.


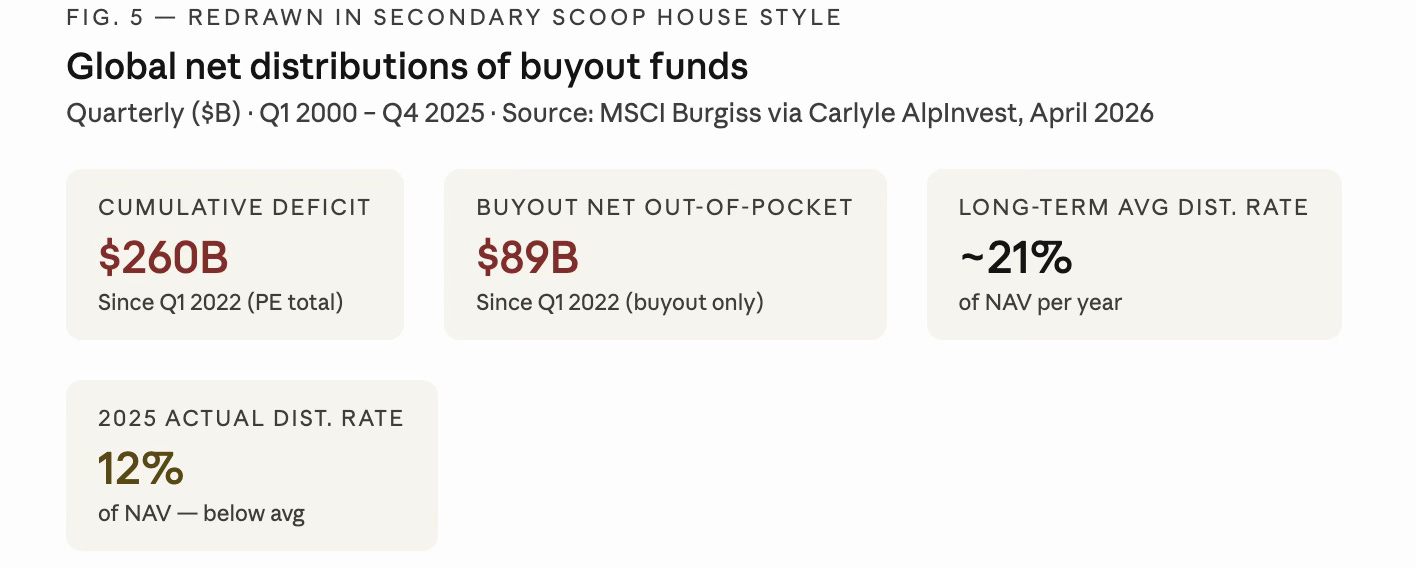
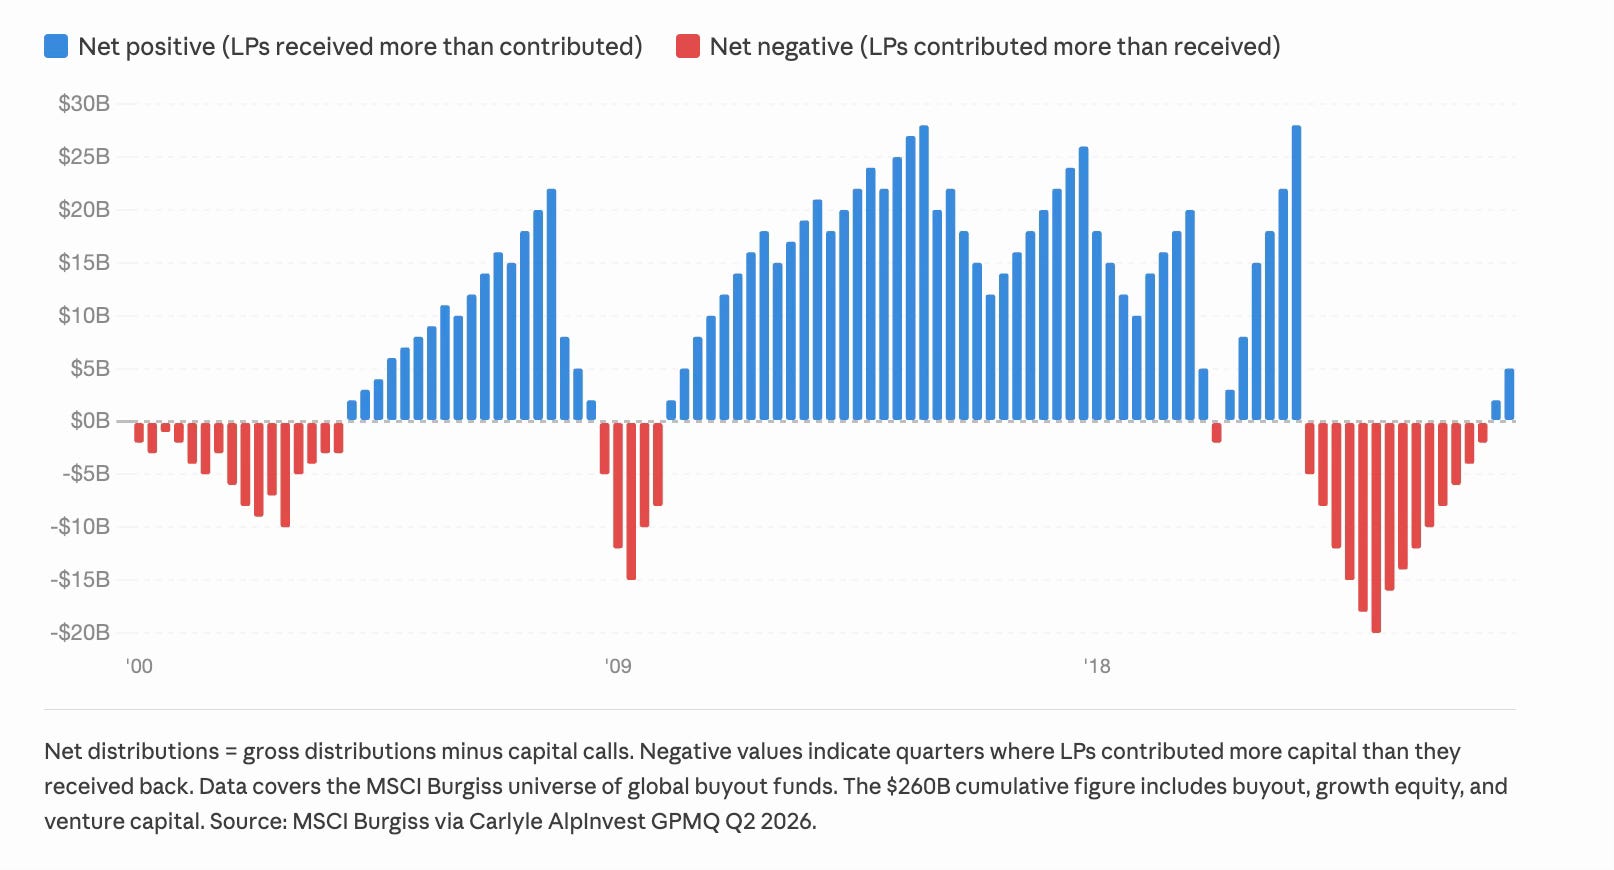
There is a number buried inside Carlyle AlpInvest’s Q2 2026 Global Private Markets Quarterly that reframes everything happening in secondaries right now. It is not the $205 billion in secondary transaction volume for 2025. It is not the dry powder figure, or the GP-led share, or the pricing spread. It is $260 billion, the cumulative amount by which private equity LPs have put more capital into their funds than they have received back since 2022.
That figure, compiled from MSCI Burgiss data and cited as proprietary Carlyle AlpInvest analysis, encompasses buyout, growth equity, and venture capital. It represents four years of a distribution drought that has quietly restructured the economics of every institutional LP portfolio in the world. And it is the single most important number for understanding why the secondaries market is not in a cyclical boom. It is in a structural one.
How We Got Here
The mechanics are straightforward. Private equity funds operate on a fundamental promise: LPs commit capital, the GP deploys it into companies, those companies are exited over a 5–7 year horizon, and cash flows back. The system works when exits flow. It breaks when they don’t.
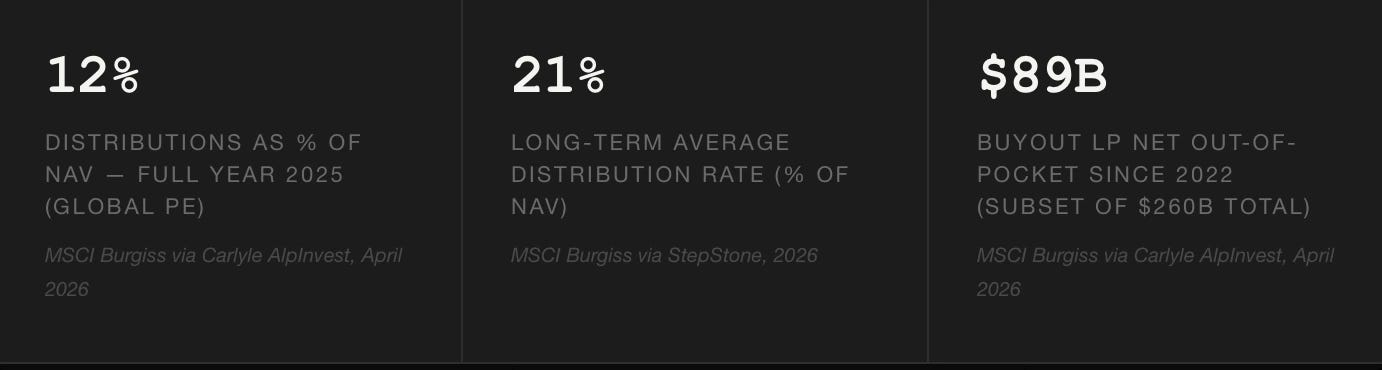
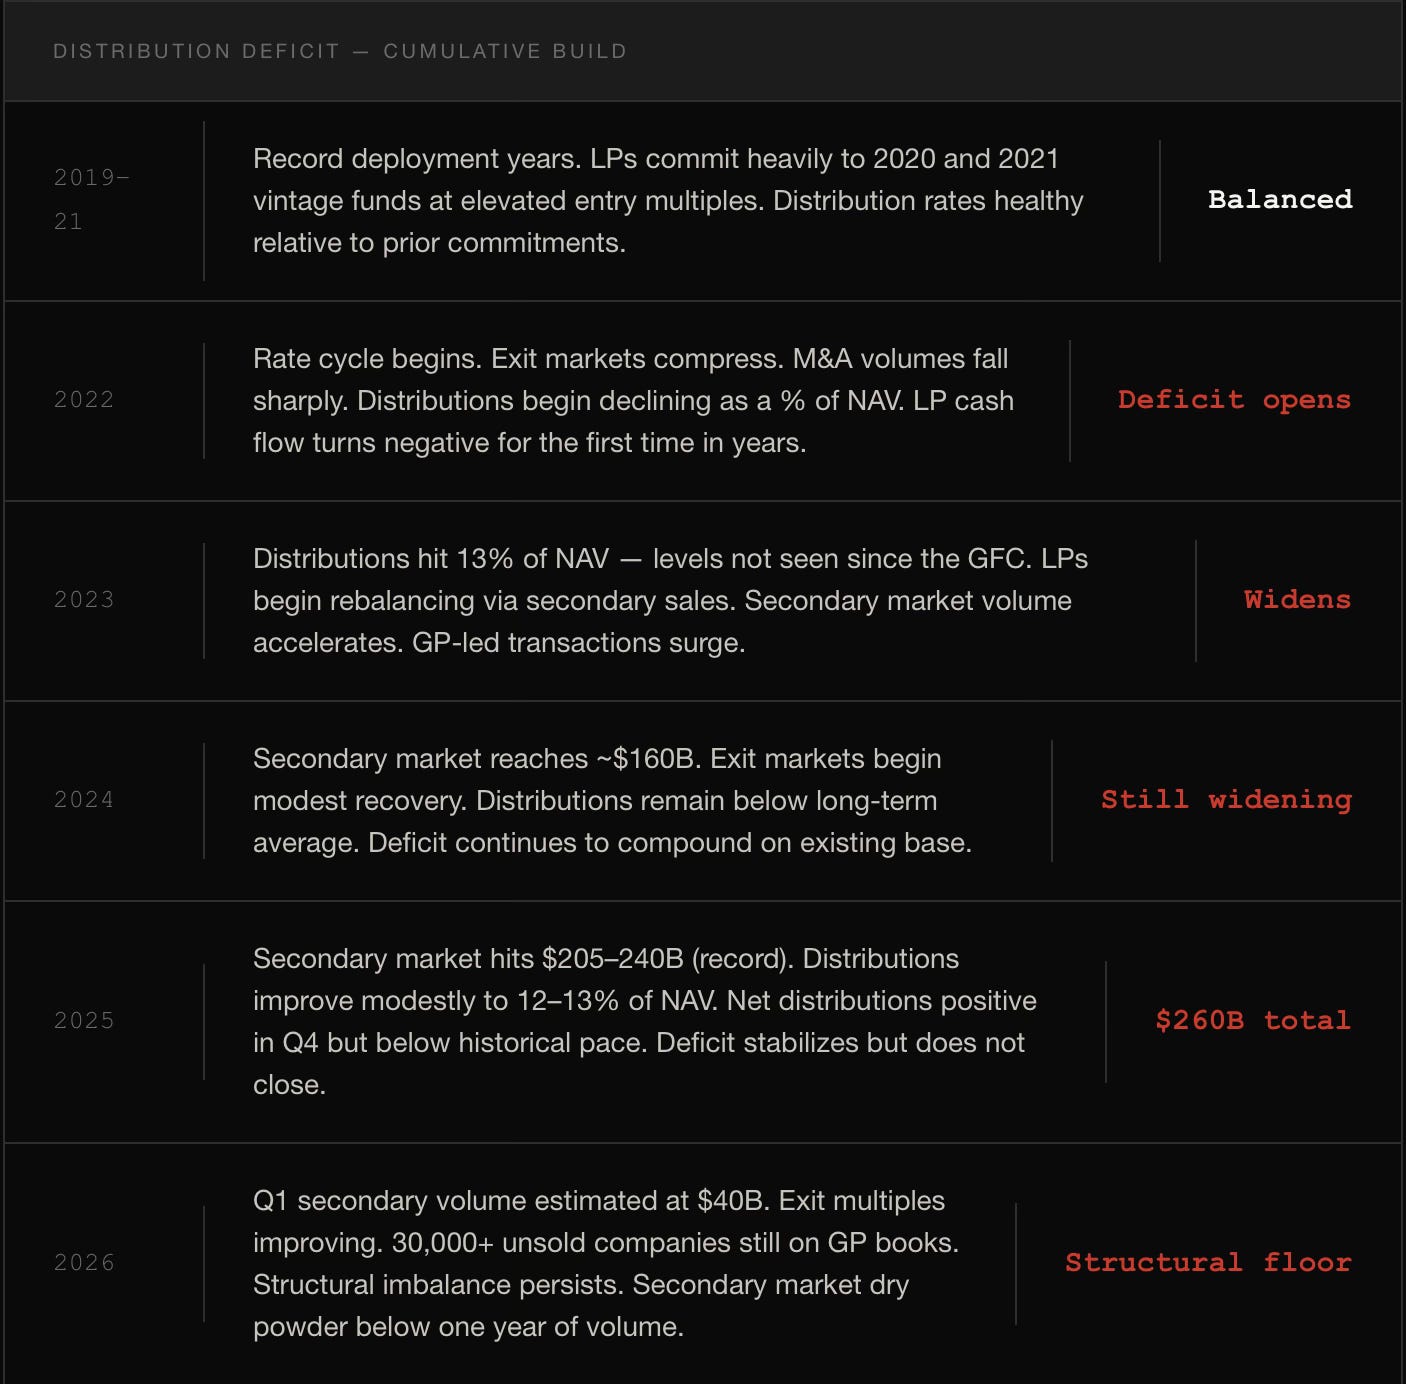
From 2022 onward, exits stalled. Rising interest rates compressed multiples. M&A markets slowed. The IPO window narrowed. GPs holding assets acquired at peak 2021 valuations found themselves unable to exit at acceptable prices. Distributions as a percentage of NAV, the metric LPs use to gauge how much cash their PE portfolios are actually returning, fell from a long-term average of roughly 20–25% of NAV to between 10–15%. The Carlyle AlpInvest report puts it precisely: distributions have remained “significantly depressed,” with the most recent full-year figure at 12% of NAV for global PE and 13% for buyout-only.
The gap between what LPs expected and what they received is not small. StepStone’s 2026 House Views put it at 0.2x DPI below budget for 2018–2021 vintages. McKinsey’s 2025 Global Private Markets Report found that 2.5 times as many LPs now rank DPI as their “most critical” performance metric compared to three years ago. The message from the LP community has been consistent: we need our money back.
But here is what matters: even as exits have modestly recovered in 2025 and into early 2026, the $260 billion hole has not closed. It has only stopped growing at the same pace. A sustained return to the 20–25% distribution rate, what would constitute a normalized exit environment, is a multi-year project, not a quarterly event.
Why the Deficit Is the Secondaries Story
Secondary market volumes are usually reported as a function of deal flow: how many portfolios came to market, what advisors ran processes, which buyers closed. What gets underreported is the demand-side pressure that creates that supply in the first place.
LPs sell fund stakes in the secondary market for many reasons. Portfolio rebalancing. Manager consolidation. Capital redeployment into new vintages. Administrative cleanup. But the dominant force since 2022 has been simpler: they need cash that their PE portfolios are not generating. The cumulative $260 billion deficit is a direct measure of that unmet need.
“This continued lack of liquidity drove the secondary market to another record year in 2025, with an estimated $205 billion of private equity deals transacted across the GP-centered and LP-interest markets.”
CARLYLE ALPINVEST GPMQ Q2 2026
The critical implication is this: as long as the deficit exists, the structural supply of secondary deal flow persists. Even if M&A markets fully reopen, even if IPO volumes recover, even if exit multiples continue their recent upward trend, the four-year backlog of unreturned capital does not disappear overnight. It takes years of above-average distributions to close a gap of this magnitude.
Carlyle AlpInvest puts the math plainly: buyout LPs alone are $89 billion net out of pocket since 2022. Adding growth equity and venture brings the figure to $260 billion. For context, the entire secondary market transacted $205 billion in 2025, its record year. The unmet distribution need is larger than the biggest year the market has ever had.
The Exit Recovery Doesn’t Change the Calculus
The natural counterargument is that improving exit markets will reduce secondary supply pressure. If GPs can exit more assets, distributions improve, LPs get their cash back, and the need to sell fund stakes diminishes. This view has been increasingly common as exit multiples have recovered, Carlyle AlpInvest’s proprietary data shows median exit EBITDA multiples for Q3 and Q4 2025 exits reaching 14.8x–15.5x, up sharply from the 11.0x–13.0x range that characterized much of 2022–2024.
The problem is the arithmetic. Even at improved exit rates, working through the backlog of unreturned capital requires sustained above-average distributions across an entire vintage cohort. Bain & Co’s June 2026 data shows PE firms sitting on over 30,000 unsold portfolio companies. Carlyle AlpInvest notes that a sustained rise in exit multiples will be needed to clear the backlog of high-priced pandemic-era deals, and that is before accounting for the interest rate environment, the SaaS valuation reset still working through credit portfolios, and the continuing uncertainty from geopolitical disruption.
The Dry Powder Signal No One Is Talking About
There is a second number in the Carlyle AlpInvest report that compounds the deficit story: dry powder for secondaries now represents less than one year of deal volume. For a market that transacted $205 billion in 2025 and is tracking toward $300 billion annually within 24 months according to Jefferies, this is a meaningful constraint.
Ropes & Gray’s Q1 2026 Secondaries Update puts secondary fundraising projections at $130–145 billion for the full year from Campbell Lutyens, with Evercore estimating over $200 billion to be raised over the next 12 months. Even the upper end of those estimates barely keeps pace with projected deal flow. Secondary buyers, not sellers, are the binding constraint in the current market.
This is not a conventional market dynamic. In most asset classes, rising volumes attract capital, which compresses returns, which moderates supply. In secondaries, the supply driver, the LP cash flow deficit, is not price-sensitive. LPs selling fund stakes to manage liquidity will continue doing so regardless of whether buyers price aggressively or conservatively. The supply is structural. The capital constraint is the variable.
What This Means for the Market
Several implications follow from taking the $260 billion deficit seriously as a long-duration structural force rather than a cyclical distortion.
First, secondary market volumes are unlikely to revert to pre-2022 levels even in an improved exit environment. The distribution gap took four years to accumulate and will take multiple years of above-average exit activity to close. In the interim, LP portfolio management via secondaries becomes a permanent feature, not a crisis response.
Second, the buyer’s market dynamic described in Carlyle AlpInvest’s Q1 2026 data, younger, higher-quality assets coming to market as LPs optimize portfolios for price, is a sign of a maturing LP seller base, not a softening market. Sophisticated LPs have internalized secondaries as a tool. The first-time sellers who drove much of 2023–2024 supply are being joined by repeat sellers managing portfolios strategically.
Third, the undercapitalization of the buyer side relative to deal flow creates structural alpha opportunity for well-capitalized, relationship-driven secondary platforms. With dry powder below one year of volume, buyers with established GP relationships and the ability to move quickly on complex transactions will extract better pricing than the crowded 2021–2022 vintage suggested.
Fourth, the distribution deficit reframes the GP-led story. Continuation vehicles are not primarily a mechanism for GPs to hold trophy assets, they are a response to LPs who need partial liquidity now without exiting entirely. The roll-or-cash-out election is structurally driven by the same deficit that drives LP-led supply. The two sides of the secondaries market are both expressions of the same underlying imbalance.
The Secondary Scoop Read
The secondaries market is frequently covered as a volume story. Record years, record transaction sizes, record fundraises. What the volume story misses is causality: why are records being set, and how durable is the driver?
The $260 billion cumulative LP cash flow deficit is the answer. It is not a market anomaly. It is a four-year structural accumulation of unmet distribution expectations across the entire institutional LP base, pensions, endowments, sovereign wealth funds, family offices, that cannot be resolved quickly even under optimistic exit scenarios.
Until that hole is filled, the secondary market has structural tailwinds that do not depend on macro conditions, interest rate cycles, or the health of any single exit route. The records are not a coincidence. They are arithmetic.
SOURCES
Carlyle AlpInvest, Global Private Markets Quarterly Q2 2026 (data as of March 31, 2026; proprietary Carlyle AlpInvest data and MSCI Burgiss, April 2026)
StepStone Group, Private Equity 2026 House Views; StepStone / Fidelity Q&A, Institutional Investor, May 2026
Hamilton Lane, 2026 Market Overview, March 2026
Jefferies Private Capital Advisory, 2025 Global Secondary Market Review, January 2026
Campbell Lutyens, 2025 Secondaries Market Flash Report, January 2026
Ropes & Gray, Secondaries Q1 2026 Update, March 2026
Bain & Company, cited in InvestmentNews, June 24, 2026 (30,000+ unsold companies figure)
PJT Partners, Q1 2026 Secondary Market Insight, April 2026 (cited in Carlyle AlpInvest GPMQ)