
The LP-Led Secondary Market in 2025
What the data from Campbell Lutyens, Jefferies, Lazard and Coller Capital actually tells us

Four reports covering the 2025 secondary market landed in early 2026: Campbell Lutyens, Jefferies, Lazard and Coller Capital. Each draws on its own deal flow, proprietary surveys and market contacts. They do not always reach the same number. But on the fundamentals of what drove LP-led secondaries in 2025, they are broadly consistent. This piece pulls together what they agree on, where they diverge, and what it adds up to.
The focus is LP-led only. No GP-led, no preferred equity.
1. Market Activity
Volume: a big year, with a range of estimates
LP-led transaction volume in 2025 came in somewhere between $110 billion and $125 billion, depending on which report you read. Campbell Lutyens puts it at $121 billion. Jefferies at $125 billion. Lazard at $117 billion. Coller, citing Evercore data, says $110 to $120 billion.
The range reflects different survey populations and different views on how to count borderline structures like NAV facilities. It is not a sign of disagreement on direction. Everyone agrees LP-led volume grew sharply year on year, somewhere between 44 and 54 percent.
As a share of total secondary market activity, LP-led sits at roughly 50 to 54 percent. Campbell Lutyens and Coller put it at 54 percent. Jefferies puts it at 52 percent. Lazard puts it closer to 50 percent. The slight disagreement matters because the GP-led market was also growing fast, so the LP share was holding steady rather than expanding.
All four agree
LP-led volume hit an all-time high in 2025. The market grew by roughly half in a single year. H2 was materially stronger than H1 across all sources.
What drove the volume
The core driver is simple: LPs have not been getting their money back from PE funds. Distributions to paid-in capital (DPI) have been running below historical norms since 2022, as the exit environment for fund managers stayed difficult. Rather than waiting, more LPs decided to sell positions in the secondary market to generate their own liquidity.
This was not a distressed dynamic. It was portfolio management. The seller mix shifted noticeably toward institutions using the secondary market as a planned, recurring tool rather than a last resort. Coller makes this point directly, noting that one in two LP-led sellers in 2025 was a repeat seller. Jefferies puts the repeat rate at roughly 60 percent. Campbell Lutyens describes the normalization of what it calls programmatic selling across LP types.
The other driver was overallocation. Public market performance in 2022 and 2023 left many institutional investors with their private equity allocations sitting above target as a percentage of total portfolio. Selling into a strong secondary market helped rebalance.
2. Transaction Pricing Analysis
Overall level
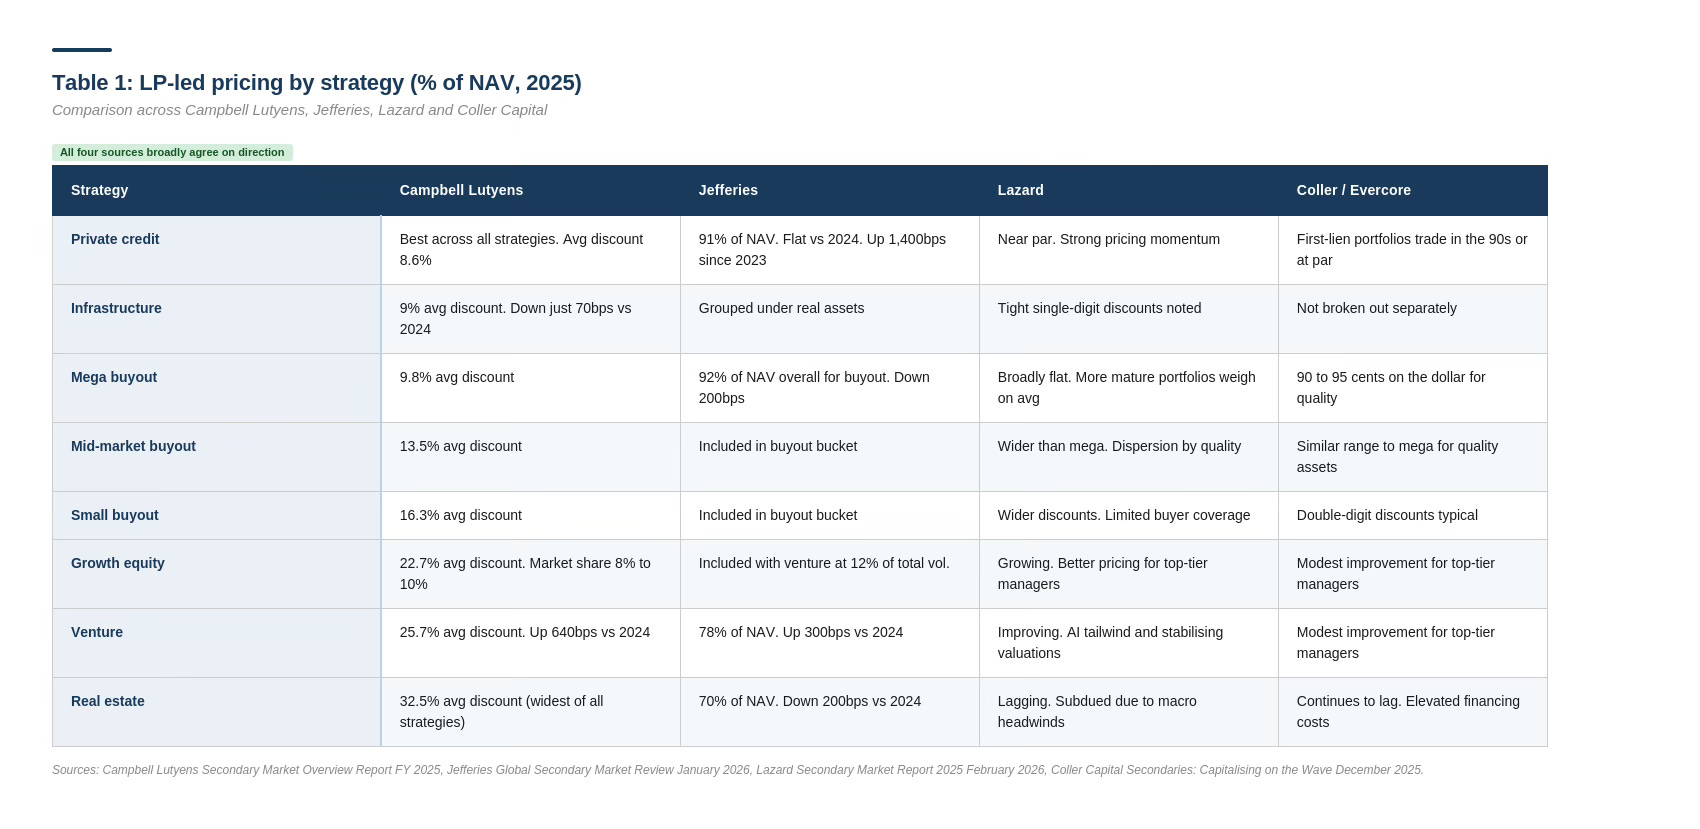
Average LP portfolio pricing in 2025 settled at roughly 86 to 87 percent of NAV, a decline of roughly 100 to 200 basis points from 2024. Campbell Lutyens quotes 86.4 percent (a 13.6 percent average discount). Jefferies quotes 87 percent. Lazard does not give a single headline number but describes a modest softening. Coller says quality portfolios transact in the 90 cents range.
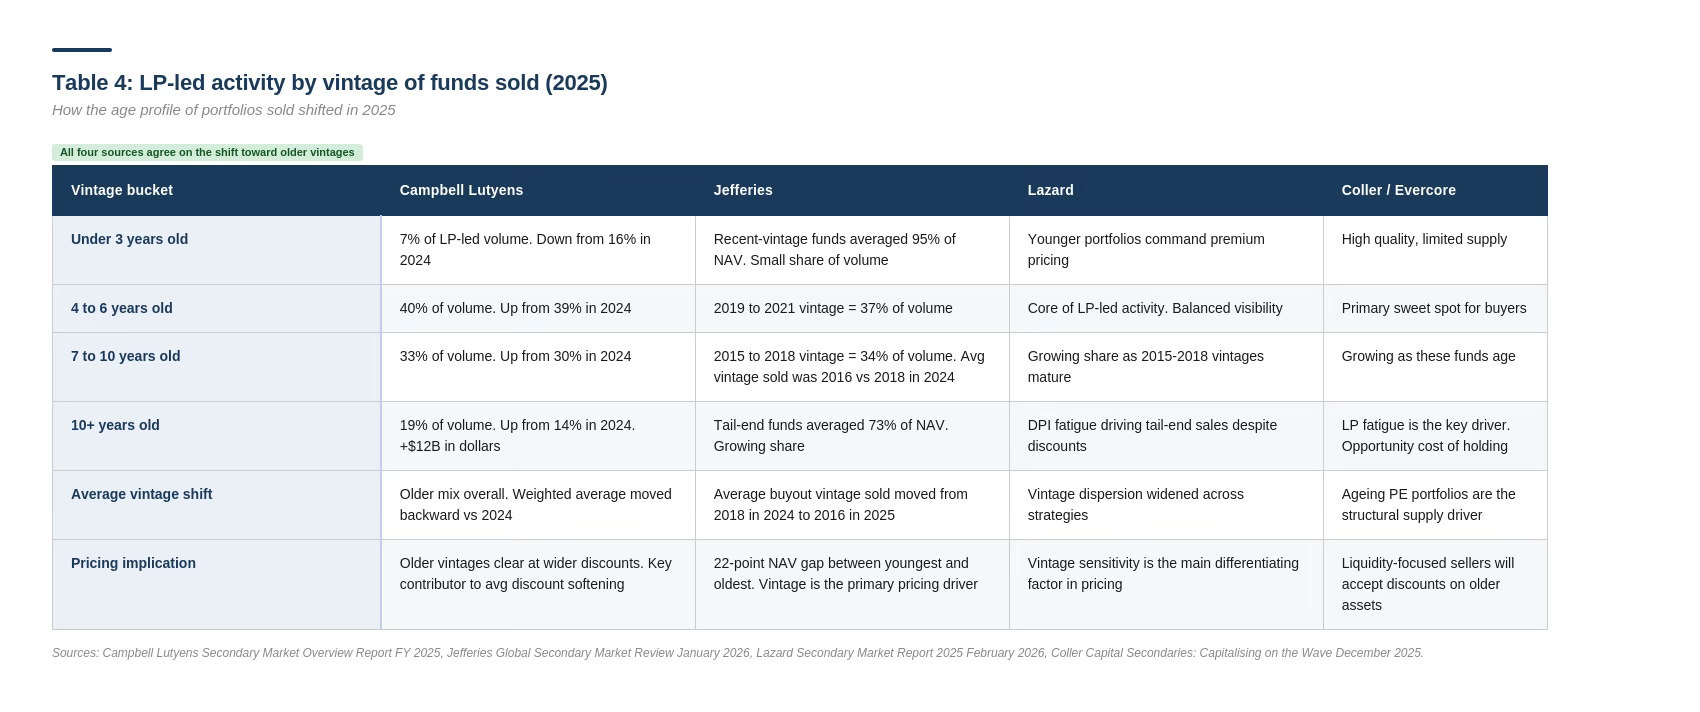
The softening is real but modest. The main reason for the decline is not weaker demand. It is a shift in what was being sold. More tail-end and older vintage funds came to market in 2025, and those clear at wider discounts than mid-life or young portfolios. The average vintage of buyout funds sold moved from 2018 in 2024 to 2016 in 2025, according to Jefferies.
Where pricing moved most
Venture and growth equity saw the biggest positive movement. Campbell Lutyens records a 640 basis point improvement. Jefferies records 300 basis points. The numbers differ because of how they weight the underlying transactions, but the direction is consistent. The stabilisation of tech valuations and the AI momentum in 2025 helped narrow bid-ask spreads, particularly for top-tier managers where secondary buyers now have more confidence in terminal valuations.
Energy also improved materially, up roughly 480 basis points according to Campbell Lutyens, driven by geopolitical interest in oil and gas and the power demand tied to AI data centres.
Credit held the best average pricing of any strategy. Growth in secondary supply for credit lagged the demand coming from dedicated credit secondary funds and generalist buyers seeking exposure to direct lending, which kept pricing tight.
Real estate remained the laggard. Elevated financing costs, structural problems in the office sector, and general uncertainty around valuations kept buyer appetite cautious. All four sources describe this consistently.
The evergreen premium
Evergreen and semi-liquid vehicles paid above market for LP portfolios in 2025, but the premium narrowed. Campbell Lutyens quantifies it at 334 basis points above the market average. That is down from 403 basis points in 2024. Jefferies and Lazard both note the compression. Coller observes that wealth capital still accounts for less than 10 percent of secondary market funding and that these vehicles tend to behave rationally, co-investing alongside flagship funds rather than paying irrational premiums.
3. Transaction Activity Analysis
Type of sellers
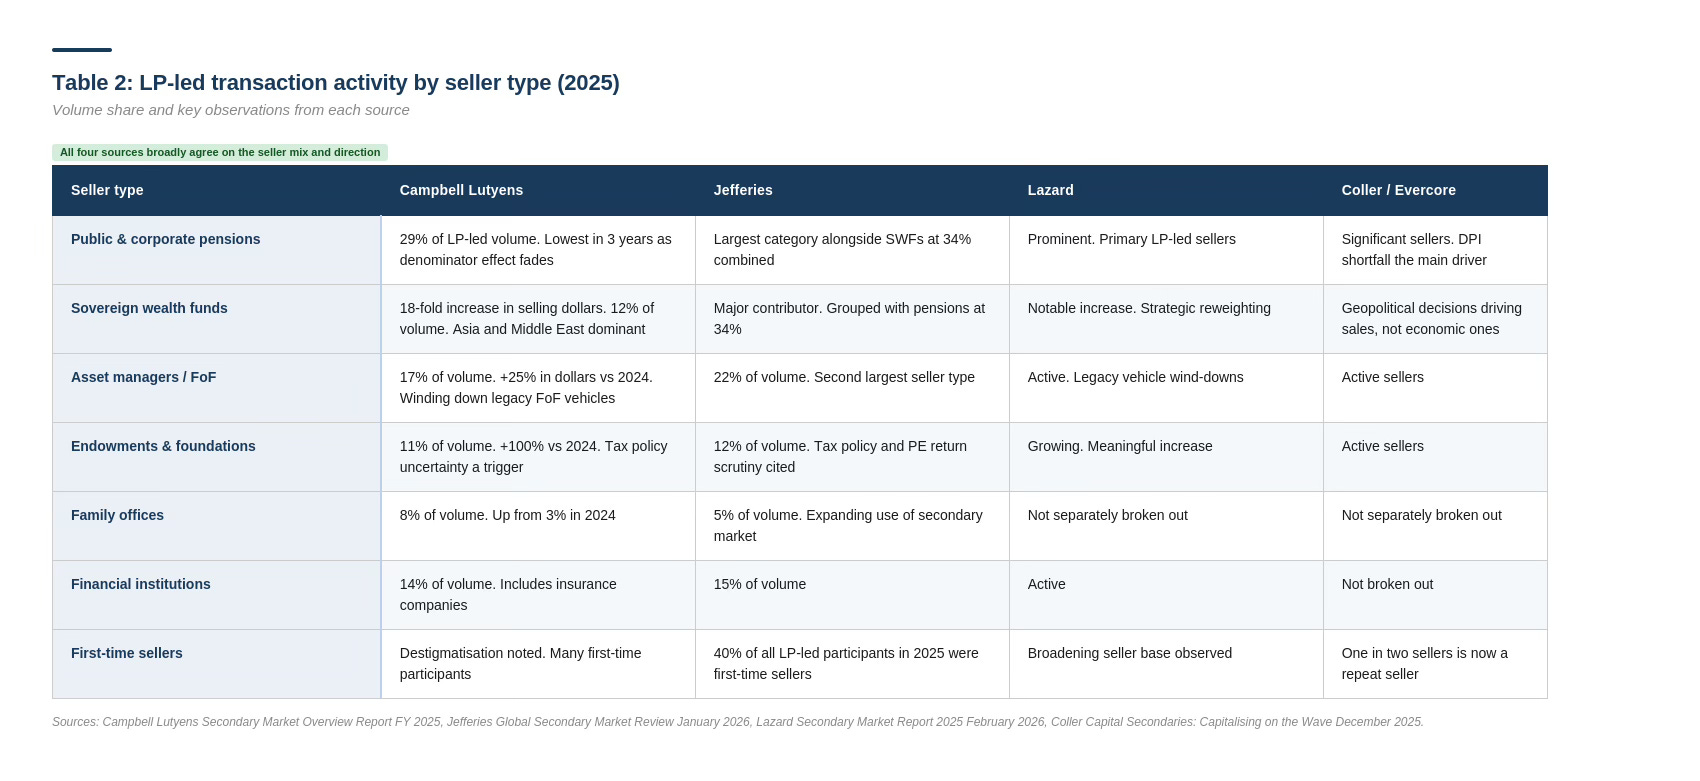
The seller base broadened noticeably in 2025. Every LP type sold more in 2025 than in 2024, according to Campbell Lutyens. But the mix shifted.
Pensions and sovereign wealth funds
These two categories remained the largest source of LP-led supply. Pensions accounted for roughly 29 to 34 percent of LP-led volume depending on the source. But what stood out in 2025 was the surge in sovereign wealth fund activity. Campbell Lutyens records an 18-fold increase in SWF selling dollars year on year. Jefferies similarly flags SWFs as a major contributor alongside pensions. The driver was strategic reweighting, not distress. Large SWFs in Asia and the Middle East decided to reduce private equity exposure, and given their scale, even modest allocation shifts produced sizeable secondary portfolios.
Endowments and foundations
This category doubled its selling volume according to Campbell Lutyens. Jefferies puts the category at 12 percent of LP-led volume. US tax policy uncertainty in 2025 was a trigger for several larger endowments, alongside a broader reassessment of private equity return expectations and liquidity profiles. Lazard and Coller both note this category as one of the faster-growing seller types.
Asset managers and fund of funds
Asset managers remained a meaningful seller category, driven by the winding down of legacy fund of funds vehicles. Campbell Lutyens notes a 25 percent increase in dollar volume from this group, as managers cleared out older vehicles skewed toward tail-end vintages. Jefferies puts asset managers at 22 percent of LP-led volume.
Family offices
Family offices expanded their participation. Campbell Lutyens records 8 percent of LP-led volume from this category, up from 3 percent in 2024. Jefferies puts them at 5 percent. Both agree the direction is up. These sellers tend to be less institutionalised in their secondary market approach, so their increased activity reflects the growing ease of transacting and the normalisation of the tool.
First-time vs repeat sellers
Jefferies reports that 40 percent of LP-led participants in 2025 were first-time sellers. Coller puts the repeat seller rate at 50 percent. Campbell Lutyens describes the broadening more qualitatively but draws the same conclusion. The two observations are consistent: the market is simultaneously attracting new participants and deepening engagement with existing ones.
Synthesis
The seller base in 2025 was more diverse than in any previous year. The growth came not from one LP type but from several simultaneously, each driven by its own motivation. SWFs were doing strategic reweighting. Endowments were managing liquidity and tax concerns. Asset managers were winding down legacy vehicles. Family offices were using the market for the first time. This breadth is structurally significant because it means LP-led supply is no longer driven by a single trigger, making it more durable.
Strategy of funds sold
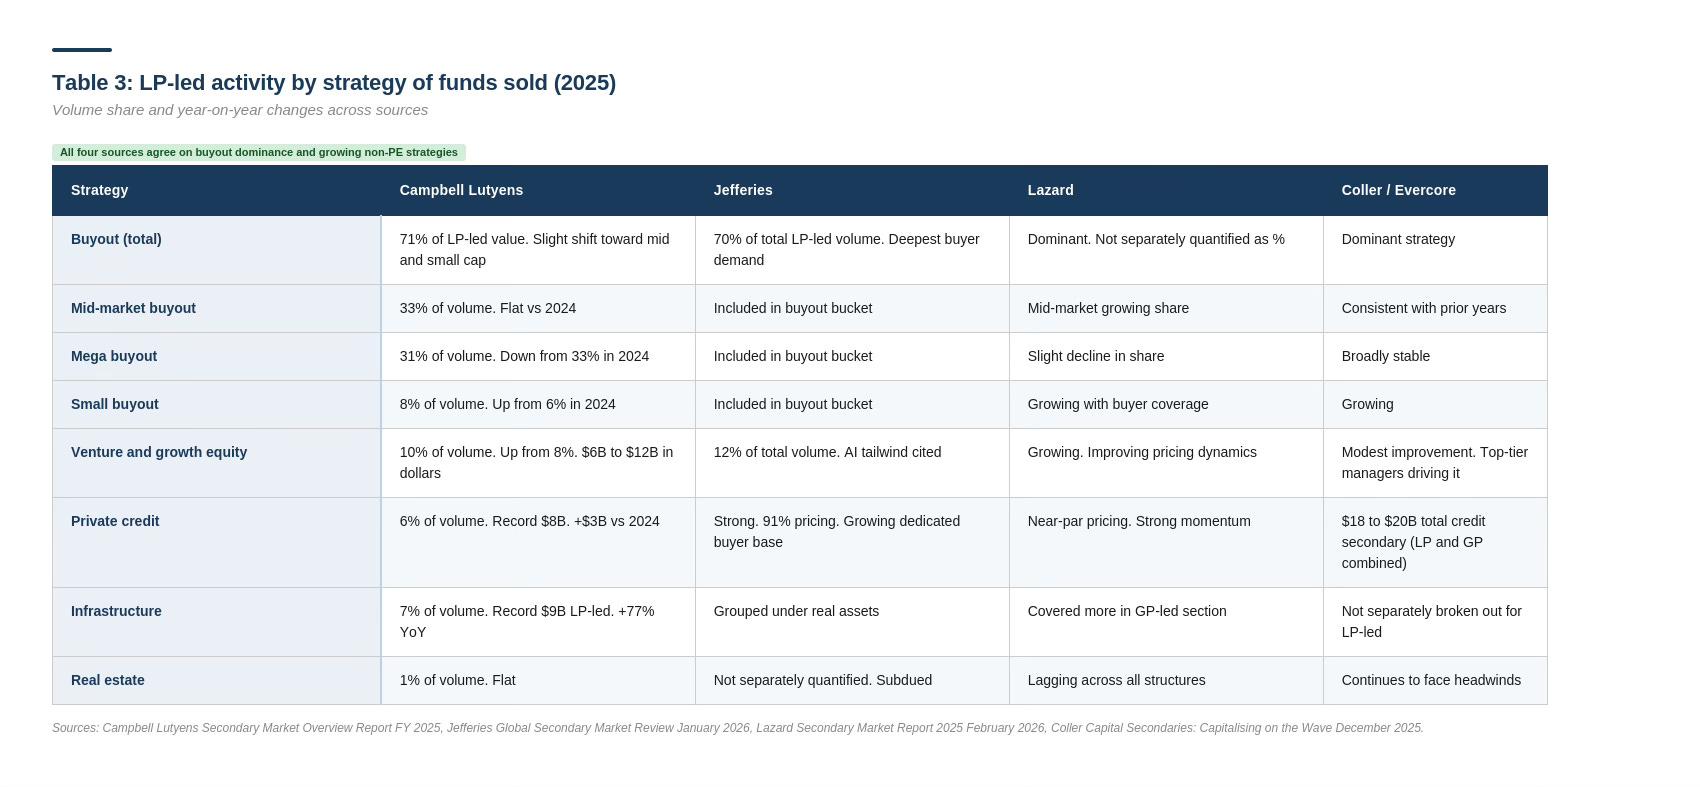
Buyout funds dominated LP-led volume in 2025, accounting for roughly 70 to 71 percent of total value across all four sources. Within buyout, there was a shift toward mid-market and small-cap, which Campbell Lutyens attributes to increased buyer coverage of those segments. Jefferies confirms the buyout dominance.
Venture and growth equity doubled in dollar terms from 2024 to 2025, reaching around $12 billion according to Campbell Lutyens. Better pricing dynamics, particularly for well-traded managers, made sellers more willing to transact. Jefferies puts venture at 12 percent of total LP-led volume.
Infrastructure and private credit each reached record LP-led volumes. Campbell Lutyens records $9 billion for infrastructure (up 77 percent) and $8 billion for private credit. The growth here reflects the maturation of specialist buyside strategies in these asset classes. Buyers who previously would not have known how to underwrite an infrastructure or credit portfolio now have dedicated teams, which clears the market more efficiently.
Vintage of funds sold
2025 saw a clear shift toward older fund vintages. Funds ten years or older accounted for 19 percent of LP-led volume, up from 14 percent in 2024, and represented a $12 billion increase in absolute dollar terms according to Campbell Lutyens. Jefferies confirms the average vintage of buyout funds sold moved backward by two years.
The cause is LP fatigue. Investors who expected exits from their 2014 to 2016 vintage funds by 2022 or 2023 are now in 2025 still holding these positions. The opportunity cost of holding tail assets with limited remaining upside has become too high. Campbell Lutyens puts it directly: LPs are fatigued waiting for exits and recognise the opportunity cost of holding tail assets.
The vintage shift also explains part of the pricing softening. Tail-end funds clear at wider discounts because there is less upside, less time, and more limited buyer familiarity with the underlying portfolio companies.
4. Target Returns Analysis
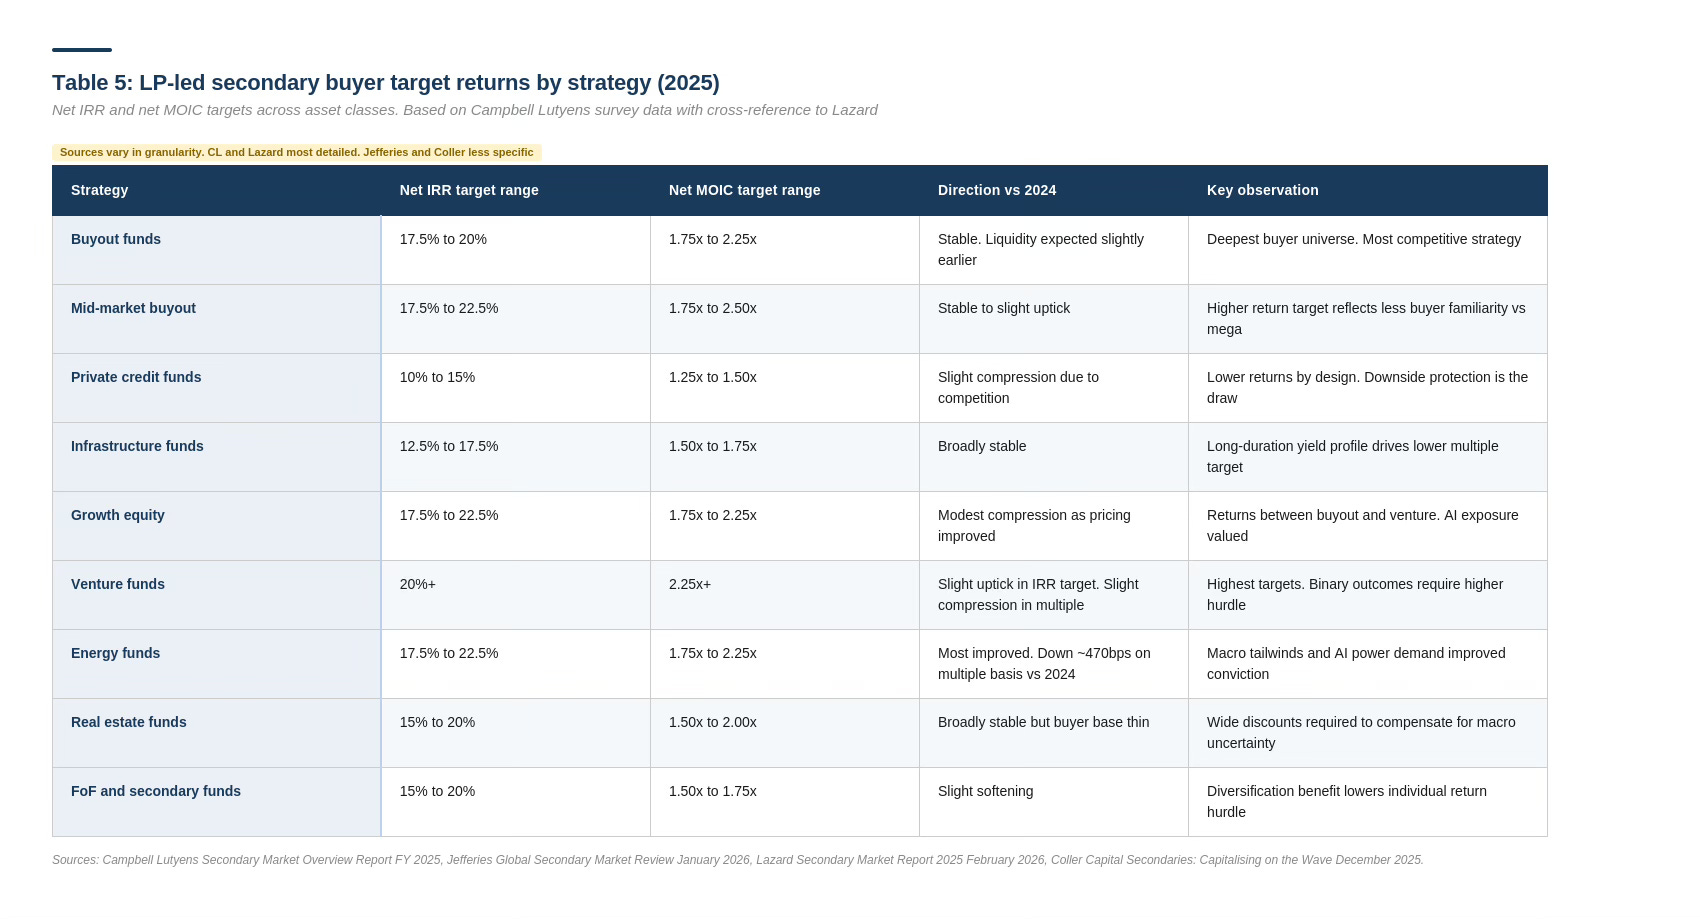
What buyers are targeting
Secondary buyers in the LP-led market are not all targeting the same return. The profile varies significantly by strategy, and the reports give a consistent picture of that dispersion even if the precise numbers differ by methodology.
For buyout funds, the consensus net IRR target sits in the 15 to 20 percent range, with most buyers clustering around 17.5 to 20 percent. Net multiple targets are typically 1.75 to 2.25x. Campbell Lutyens reports that buyout underwriting remained broadly consistent with 2024, with liquidity expected slightly earlier.
For credit funds, return targets are lower by design. Buyers are seeking 10 to 15 percent net IRR and 1.25 to 1.50x net multiples. The lower return expectations reflect the different risk profile: senior direct lending portfolios have less upside but considerably more downside protection. Campbell Lutyens notes that credit experienced some compression in return expectations in 2025 due to increased competition.
For venture and growth equity, targets are higher to compensate for binary outcomes and valuation uncertainty. Most buyers target 20 percent or above on an IRR basis, and 2.25x or above on a multiple basis. The improved pricing environment in 2025 required buyers to accept some compression, but the return expectations remain at the higher end of the LP-led spectrum.
Infrastructure buyers target the middle of the range, roughly 12.5 to 17.5 percent IRR and 1.50 to 1.75x net multiple, reflecting the long-duration, yield-oriented nature of the asset class.
Movement from 2024 to 2025
Campbell Lutyens tracks year-on-year changes in target returns and reports a nuanced pattern. IRR targets edged up slightly for most strategies, while multiple targets softened slightly. This reflects a shift in emphasis toward near-term liquidity. Buyers are placing more weight on getting capital back quickly and less weight on terminal multiple. It is consistent with the broader DPI focus across the market.
Energy was the outlier. Target returns in energy fell meaningfully (around 470 basis points on a multiple-adjusted basis) as improving macro conditions made energy assets less discounted and buyer confidence grew. The 2025 macro backdrop, including geopolitical energy security concerns and AI power demand, made energy a more mainstream LP-led category.
5. LP Pricing Trends
The quality premium
The single most consistent finding across all four reports is that quality commands a premium. Top-quartile large-cap and mid-market buyout funds continued to price at near par or at premium in 2025. First-lien credit portfolios cleared in the low 90s or at par. High-quality infrastructure transacted at single-digit discounts.
The average discount widened not because high quality got cheaper but because the mix of what was sold shifted toward lower-quality and older-vintage assets. If you strip out tail-end and distressed-adjacent portfolios, pricing for core buyout was broadly stable year on year.
Vintage sensitivity
Pricing in 2025 was steeply sensitive to fund age. Jefferies quantifies this directly: funds under five years old averaged 95 percent of NAV. Tail-end funds over ten years old averaged 73 percent. That is a 22-point spread based purely on age. The implication for sellers is that waiting costs money. An LP sitting on a 2014 vintage fund in 2025 is accepting a 27-cent-on-the-dollar haircut to exit. That is a deliberate choice, driven by the opportunity cost of holding and the desire to redeploy into newer vintages.
Geographic pricing
North American assets commanded the highest average pricing in 2025. Jefferies puts the average for North American LP portfolios at 88 percent of NAV. European assets averaged 86 percent. Asian assets averaged 56 percent, reflecting the geopolitical and macro uncertainty in the region.
The EMEA picture is worth noting specifically. Campbell Lutyens observes that fewer EMEA funds were sold in 2025, and attributes this to improved sentiment toward European PE. European valuations have been more conservative than US equivalents, and with rates coming down, LPs who held European positions saw improved perceived upside. Coller takes a different view, describing European LPs as increasingly proactive and willing to accept discounts. Lazard notes a modest decline in European GP-led volume alongside some geopolitical pressure. The disagreement is real. The most likely reconciliation is that some European LPs held on while others, particularly those with specific liquidity pressures, became more willing to transact at modest discounts.
Deferred payments
The use of deferred payment structures increased in 2025. Campbell Lutyens reports that 64 percent of buyers used deferred structures, up from 60 percent in 2024, and that the average deferral period extended from 8 to 10 months. Jefferies puts the prevalence at 23 percent of transactions, with deferral structures improving pricing by around 300 basis points for sellers. Lazard reports a similar trend, with longer payout periods and a greater proportion of consideration deferred.
The logic is straightforward. Sellers want higher optical pricing. Buyers are willing to pay it if some of the consideration is deferred, because the time value of money benefits the buyer. It is effectively a financing arrangement embedded in the transaction structure. The increase in its use reflects the market finding efficient ways to bridge bid-ask gaps without either side having to fully concede.
6. 2026 Market Sentiment and Outlook
Volume expectations
All four sources expect LP-led volumes to grow further in 2026. The specific numbers vary. Campbell Lutyens expects the overall secondary market to exceed $250 billion, with LP-led volume continuing to grow as a structural component. Jefferies sees line of sight to total market volume approaching $300 billion within 12 to 24 months, with H1 2026 alone expected to exceed $100 billion based on deal backlog. Lazard forecasts $275 billion for the overall market. Coller cites a backlog significantly higher than the prior year as supporting evidence for continued momentum.
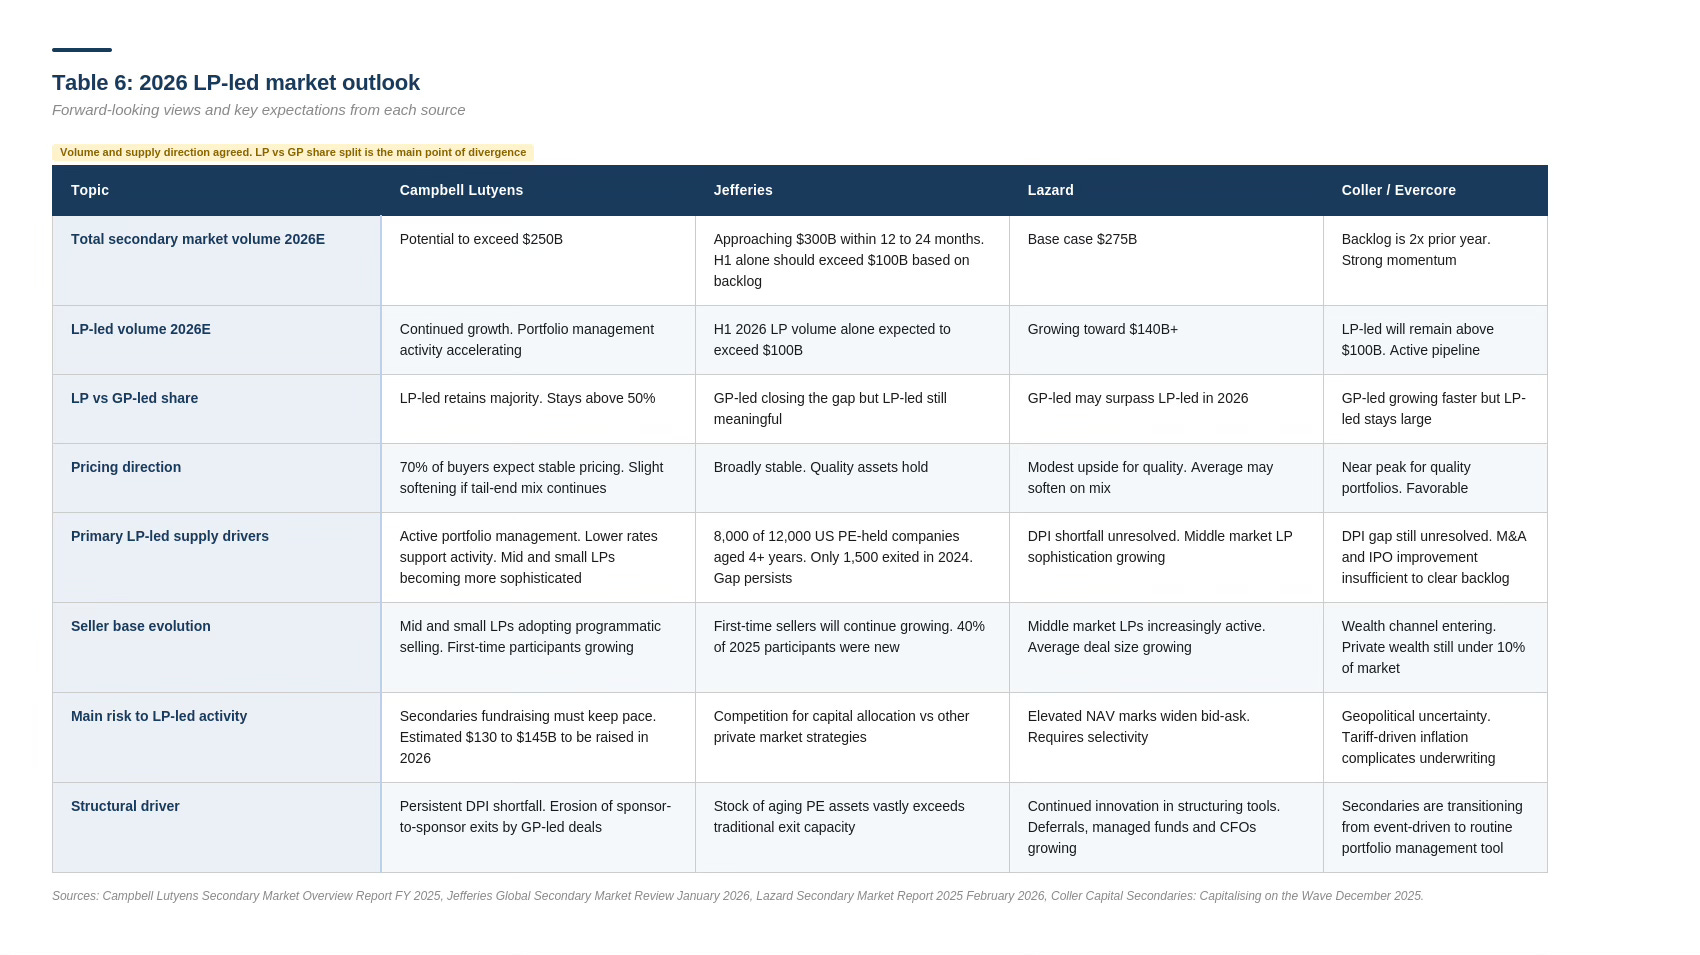
What will drive LP supply in 2026
The DPI shortfall that drove sellers to market in 2025 has not been resolved. The M&A and IPO markets improved in 2025, but not to a level that fully addressed the backlog of unrealised assets sitting in PE funds from the 2015 to 2020 vintage years. Campbell Lutyens points out that M&A activity is projected to increase in 2026 but will still struggle to meet LP liquidity needs.
Jefferies makes a specific observation: of the roughly 12,000 US companies held in PE funds, around 8,000 are four years old or older. In 2024, only 1,500 exited. The gap between the stock of mature assets and the pace of exits is the structural driver of LP-led supply, and it is not going away quickly.
Mid-sized and smaller LPs are expected to become more active sellers in 2026. Campbell Lutyens describes this as growing sophistication, with smaller institutions adopting the same programmatic selling strategies previously seen only among large pension funds. Lazard makes the same observation.
Pricing in 2026
The consensus is that pricing will remain broadly stable. Campbell Lutyens reports that 70 percent of buyers expect LP-led pricing to be roughly unchanged in 2026. Jefferies puts it similarly. The macro environment, with stable public markets and gradually declining interest rates, is supportive. Sellers of quality assets will continue to find strong demand.
The caveat is the vintage mix. If LP-led supply in 2026 continues to skew toward older and more tail-end portfolios, average pricing will drift down further even if individual high-quality portfolios hold firm. The market is not getting cheaper at the top end. It is seeing more volume at the lower end, which pulls the average down.
The LP-led vs GP-led question
One genuine point of disagreement across the reports is whether LP-led will retain its majority share or whether GP-led will surpass it. Campbell Lutyens expects LP-led to stay ahead. Lazard predicts GP-led will surpass LP-led in 2026. Jefferies sits in the middle. Coller emphasises that GP-led is growing faster.
The resolution probably depends on how large GP-led transactions become. If sponsors continue to run $3 to $5 billion multi-asset continuation vehicles, GP-led volume can grow rapidly even if the number of transactions does not. LP-led volume is more diffuse, coming from thousands of sellers across the LP base. Both markets are growing. The share question is less important than recognising that supply on both sides is structurally supported.
Synthesis: What the Four Reports Add Up To
Reading all four together, the picture that emerges for LP-led secondaries is coherent even where the numbers differ.
LP-led is now a mainstream portfolio management tool. The destigmatisation is essentially complete. Half or more of sellers in 2025 had done it before. The market is no longer driven by distress or forced sales. It is driven by rational decisions about opportunity cost, overallocation and liquidity needs.
Volume growth in 2025 was real and broad-based. It came from multiple seller types simultaneously, across multiple geographies and strategies. That breadth makes the growth durable rather than episodic.
Pricing held up well at the quality end. The average softened because the mix of what was sold included more tail-end and older vintage assets. Buyers have not become less willing to pay for quality. They have become more selective about what they will pay full price for.
The structural supply driver, which is the gap between the stock of mature PE assets and the pace of traditional exits, remains in place going into 2026. The M&A and IPO improvement in 2025 helped but did not close the gap. LP-led secondary volume will continue to grow as a consequence.
The main uncertainty for 2026 is not on the supply side. It is on the demand side. Secondary fundraising needs to keep pace with rising supply. If it does, pricing holds. If it does not, discounts widen. Campbell Lutyens estimates $130 to $145 billion will be raised for secondaries in 2026. If that capital gets deployed, the market absorbs the supply and pricing remains broadly stable. That is the base case. It is also not guaranteed.
Sources: Campbell Lutyens Secondary Market Overview Report (FY 2025), Jefferies Global Secondary Market Review (January 2026), Lazard Secondary Market Report 2025 (February 2026), Coller Capital Secondaries: Capitalising on the Wave (December 2025). All data points cited in this piece are drawn directly from these four reports. Where sources disagree, both views are presented.